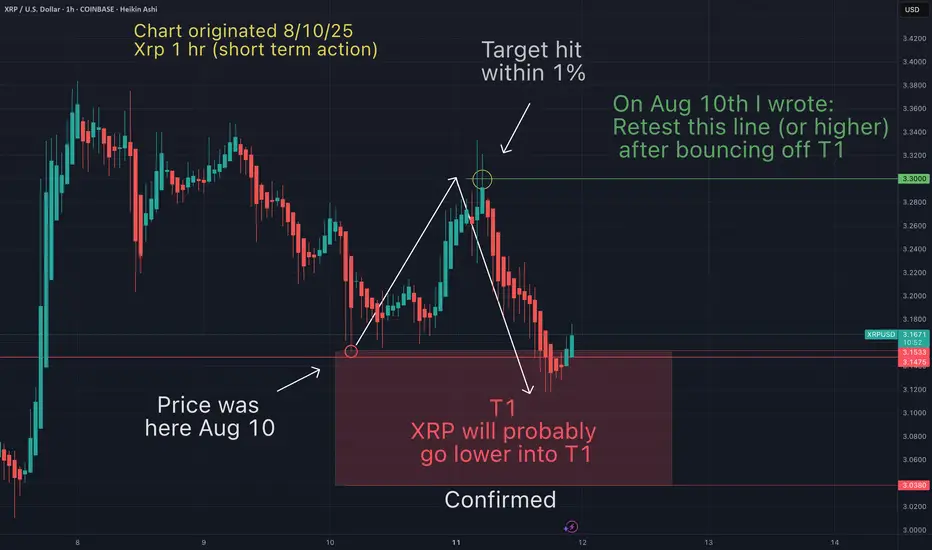
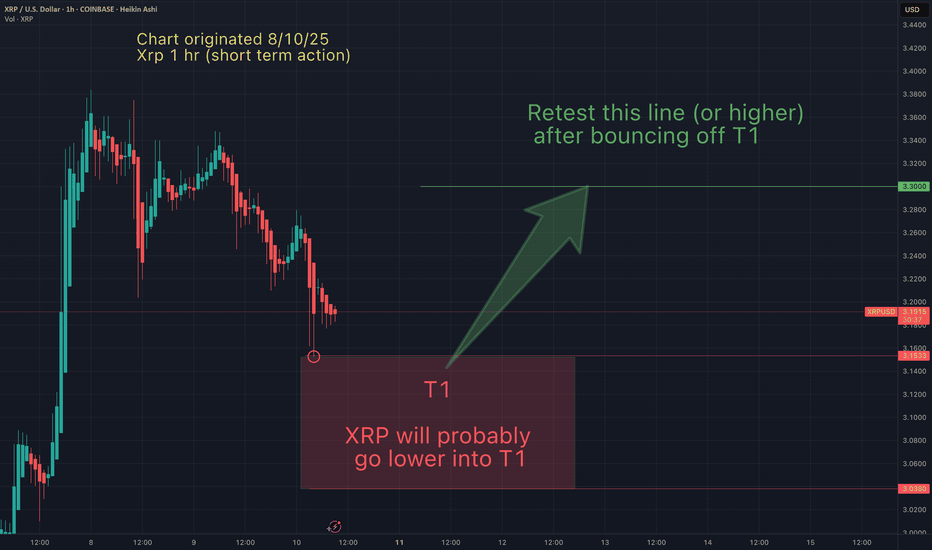
On Aug 10th I suggested the following (see Aug 10th chart below to confirm):
1-My T1 (red box) had been hit, and expecting a bounce (confirmed)
2-Xrp would bounce up to hit $3.3 (confirmed within 1%)
3- After hitting $3.3, "Xrp will probably go lower into T1 (confirmed as of today)
4-Suggested this price action would complete within 1-3 days (confirmed)
Strangely accurate again. These patterns just keep repeating over and over. I can teach you how to identify them (currently accepting 2 new private students).
This chart illustrates that TA works in the short term as well (24hr period)). These principles can applied on ANY timeframe on ANY asset.
Once again I keep stats on my accuracy, and I would do the same for anyone I would follow. How else would I know if they are worth following.
May the trends be with you.
May the trends be with you.
Disclaimer
The information and publications are not meant to be, and do not constitute, financial, investment, trading, or other types of advice or recommendations supplied or endorsed by TradingView. Read more in the Terms of Use.
May the trends be with you.
Disclaimer
The information and publications are not meant to be, and do not constitute, financial, investment, trading, or other types of advice or recommendations supplied or endorsed by TradingView. Read more in the Terms of Use.