Simple answer, Yes!
Complicated answer, it depends.
XRP is showing very strong bullish signs on weekly time frame.
- RSI broke new high after more than 2 years
- 20 and 50 EMA gave buy signal after 2 years
Two very strong bullish signals.
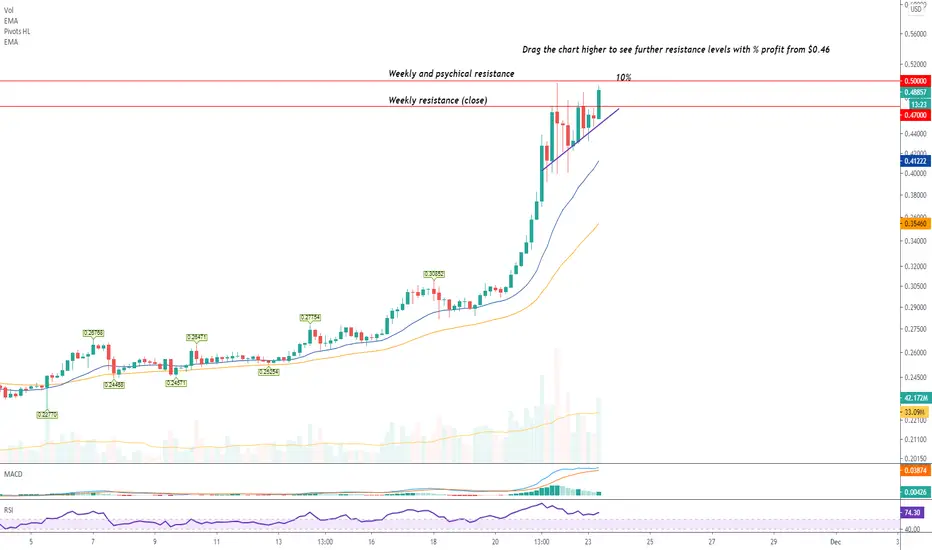
2H time frame
-Price is in, sorry, it's breaking from Ascending triangle bullish continuation pattern.
- MACD is about to see another buying wave
- RSI is still showing much potential to seek higher levels
The bullish momentum will be confirmed by a break of $0.50 mark.
For the next resistance levels, please drag the chart higher to see them.
Good luck!
Complicated answer, it depends.
XRP is showing very strong bullish signs on weekly time frame.
- RSI broke new high after more than 2 years
- 20 and 50 EMA gave buy signal after 2 years
Two very strong bullish signals.
2H time frame
-Price is in, sorry, it's breaking from Ascending triangle bullish continuation pattern.
- MACD is about to see another buying wave
- RSI is still showing much potential to seek higher levels
The bullish momentum will be confirmed by a break of $0.50 mark.
For the next resistance levels, please drag the chart higher to see them.
Good luck!
Note
This rally is not ending yet Note
Is this really it.. a breakout? Well it may be one indeed as the demand on RSI is breaking into a new high for the past three years and the price of XRPBTC seems to have bottomed! Trade closed: target reached
I am closing this idea as the highest resistance of $0.80 was tested, I haven't took any profit yet, current price $0.65.Note
Maybe just two more updates.. :) It's important to hold this 50 EMA, because the break of it will push the price in a corrective wave on 1h time frame Note
on 1h time frame we can see that the price of XRP has found support on 20 EMA which os 15m 50 EMA, and the break below would mean a retest of 0.5430, 50 EMA.Note
Related publications
Disclaimer
The information and publications are not meant to be, and do not constitute, financial, investment, trading, or other types of advice or recommendations supplied or endorsed by TradingView. Read more in the Terms of Use.
Related publications
Disclaimer
The information and publications are not meant to be, and do not constitute, financial, investment, trading, or other types of advice or recommendations supplied or endorsed by TradingView. Read more in the Terms of Use.