Wanted to make final macro view perspective on how I see things playing out based on the knowledge I have on curve projections and wave counts in crypto.
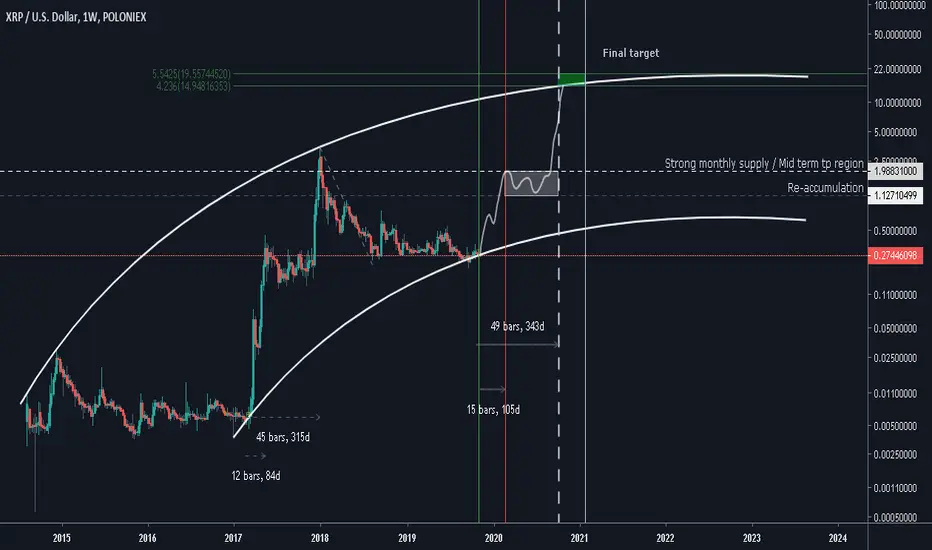
I didn't put wave count on the chart to keep it as clear as possible. It's clear that we're gearing up for the final 5th wave up on logarithmic chart..
Pivotal point / strong buy signal occurred on Nov 4th. But we still got at least one more week to jump on this train at cycle changing point.
To get a price using curve pattern is easy, although not as easy with timing.. Let me explain, how did I came up with this timing:
[We're in the fifth leg up using Elliot wave count. I used different examples of where this projection played out and tried to come up with the formula of how to use the formula in xrp chart using previous price action print of wave 3]
[I studied BTC.D projection the most to see how V wave was different from III in terms of timing]
[What I found out is that 5th wave took about 20-25% longer to reach that curve than 3rd one from its bottom, then I looked up XRP'S last wave up and how long it took to finish that leg]
[I pulled up fibonacci tool for timing and adjusted my formula with this tool's pivotal points.. As it turns out, they were matching together to the exact week.. :)]
$1.99-$1.13 region is monthly last supply zone before ATH.. Again, I looked up BTC/USD impulsive move in the summer, when we stopped exactly at the top of last supply zone on BTC/USD chart and didn't revisit for more than 4 months now.
Idea is to sell some or all of your coins at that $1.98, enjoy life time profits for couple of months, then re-enter at $1.13-$1.15. Gear up for the final impulse move before multi-year consolidation again (unless fundamentals says differently at that given moment and time).
Focus on the long term picture, I know it's hard, but totally worth it.. If it was to play out the way I drew it, we're only a year away from life changing profits. Patience!
I'll attach BTC.D chart in related ideas down below, have a look!
I hope you got something useful from this chart! Like and let me know what you think in the comments. :)
This is not financial advise.
Note
Guys, be careful if you want to open longs here.. We still need one more re-test of crucial daily supply zone at $0.25-0.26.. My target to open more longs are at $0.254.. This is not an advise, just a reminder that we might see some wicks to the downside :)Related publications
Disclaimer
The information and publications are not meant to be, and do not constitute, financial, investment, trading, or other types of advice or recommendations supplied or endorsed by TradingView. Read more in the Terms of Use.
Related publications
Disclaimer
The information and publications are not meant to be, and do not constitute, financial, investment, trading, or other types of advice or recommendations supplied or endorsed by TradingView. Read more in the Terms of Use.