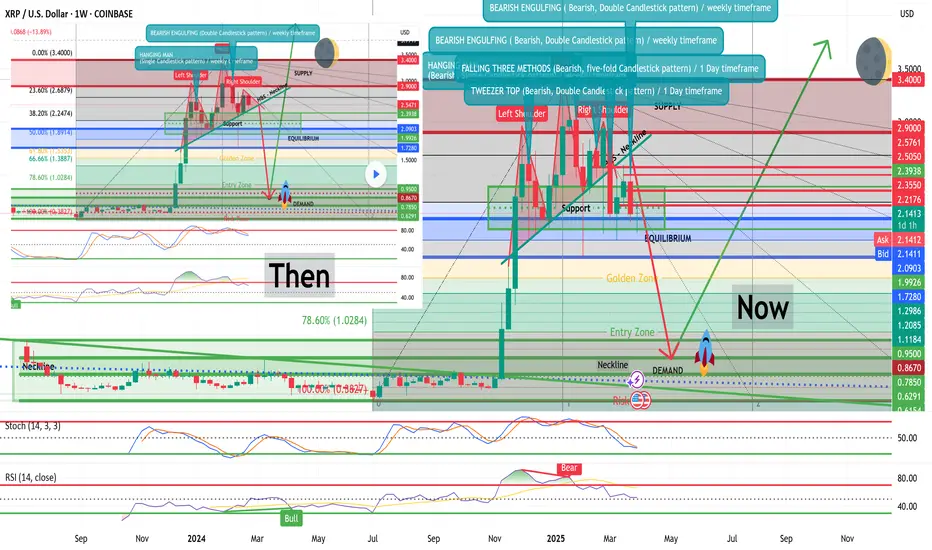
THEN - NOW@ XRP Weekly-Monthly Analysis / Retracement Levels for Buy (...and we keep going)
Weekly - Monthly trend: Bearish
Chart Pattern: Head & Shoulders (H&S) - Bearish Continuation Pattern
Bearish Candlesticks signals:
HANGING MAN (Bearish, Single Candlestick pattern) / Weekly Timeframe / 09 DEC 2024
BEARISH ENGULFING (Bearish, Double Candlestick pattern)/ weekly Timeframe / 27 JAN 2025
TWEEZER TOP (Bearish, Double Candlestick pattern) / 1 Day timeframe / 20 FEB 2025
FALLING THREE METHODS (Bearish, five-fold Candlestick pattern) / 1 Day timeframe / 07 MAR 2025
BEARISH ENGULFING (Bearish, Double Candlestick pattern)/ weekly Timeframe / 24 MARCH 2025
Retracement Fib Price Levels:
0.00% (3.4000)
23.60% (2.6879)
38.20% (2.2474)
50.00% (1.8914)
61.80% (1.5353)
78.60% (1.0284)
100.00% (0.3827)
Good prices for buy (the lower the better):
61.80% (1.5353) – Golden Zone / Golden Pocket
78.60% (1.0284) – Entry Zone
Between 78.60% (1.0284) and 100.00% (0.3827) is the Risk Zone, which we have the Neckline of the ‘’ Quadruple Bottom Pattern ‘’ at the price range ‘’ 0.6291 – 0.7850 ‘’
Disclaimer
The information and publications are not meant to be, and do not constitute, financial, investment, trading, or other types of advice or recommendations supplied or endorsed by TradingView. Read more in the Terms of Use.
Disclaimer
The information and publications are not meant to be, and do not constitute, financial, investment, trading, or other types of advice or recommendations supplied or endorsed by TradingView. Read more in the Terms of Use.