As you can tell from the very first chart,  XRP looks like its ready to take off on a rocket ship soon.

Above you can see a chart ofXRP on the  BTC pairing. As should be obvious, you can see that XRP has been sort of going crazy lately on this pairing ever since approximately July 30th/31st.
Now, please take note that this is just the 1H Chart that I’m looking at, and this mini uptrend has only prevailed for approximately 4–5 days, which is hardly any length of time, even in crypto.
However, from what I’m seeing, this is bullish forXRP holders.

This picture above shows the strong uptrend thatXRP has been on in the last few days on the 1H chart.

Let’s throw on top of it that it appears as though a bull pennant has formed (and been successfully broken) on this chart as well, which is a very good sign.
However, one major point of concern here is the declining volume over the last couple of weeks:

Now let’s examine why in the worldXRP has been experiencing such bullish price action against $BTC.
To Do So We Need to Look at theXRP / USD Chart First

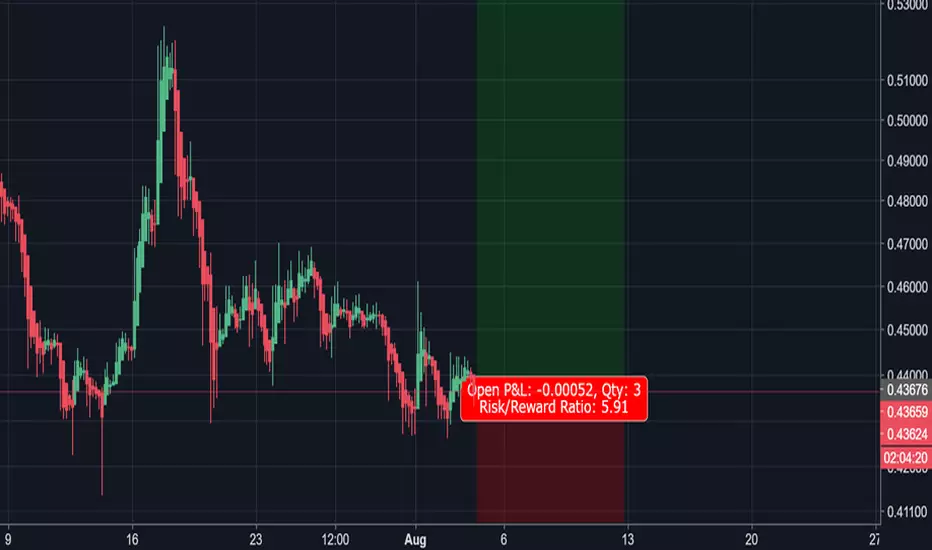
As you can see in the picture above, the price ofXRP on the USD chart has met against that super long-term resistance point of $0.40-$0.43 as it grinds at the apex of this VERY lengthy triangle pattern.
Now, Let’s Check Out the Price Movement forBTC / USD

The price ofBTC appreciated between 7/19–7/26 (15.54%) and between 7/30 to present the price has dropped substantially (-13.08%).
Now, Let’s Go Back to the XXRP/BTC Chart and See How This Coincides:

Should be pretty obvious what’s going on here.
This is why the combined short onBTC + the long on XRP was advocated in the past from me.
Strategy/Conclusion
Given the fact that this is what the RSI onBTC looks like at this present moment in time:

It feels like a continued long on the $XRP/BTC pairing would be a wise idea.
However, if I were a trader entering this trade, I’d set a stop loss at $0.40 on $XRP. If it breaks to that point, you’re in danger zone.
Above you can see a chart of
Now, please take note that this is just the 1H Chart that I’m looking at, and this mini uptrend has only prevailed for approximately 4–5 days, which is hardly any length of time, even in crypto.
However, from what I’m seeing, this is bullish for
This picture above shows the strong uptrend that
Let’s throw on top of it that it appears as though a bull pennant has formed (and been successfully broken) on this chart as well, which is a very good sign.
However, one major point of concern here is the declining volume over the last couple of weeks:
Now let’s examine why in the world
To Do So We Need to Look at the
As you can see in the picture above, the price of
Now, Let’s Check Out the Price Movement for
The price of
Now, Let’s Go Back to the XXRP/BTC Chart and See How This Coincides:
Should be pretty obvious what’s going on here.
This is why the combined short on
Strategy/Conclusion
Given the fact that this is what the RSI on
It feels like a continued long on the $XRP/
However, if I were a trader entering this trade, I’d set a stop loss at $0.40 on $XRP. If it breaks to that point, you’re in danger zone.
Disclaimer
The information and publications are not meant to be, and do not constitute, financial, investment, trading, or other types of advice or recommendations supplied or endorsed by TradingView. Read more in the Terms of Use.
Disclaimer
The information and publications are not meant to be, and do not constitute, financial, investment, trading, or other types of advice or recommendations supplied or endorsed by TradingView. Read more in the Terms of Use.