This price analysis will be dedicated to dissecting the future price action of the Ripple coin. This coin is probably one of the most highly anticipated and suggested coins in the T10, so we’ll make sure to take our time in dissecting this piece.

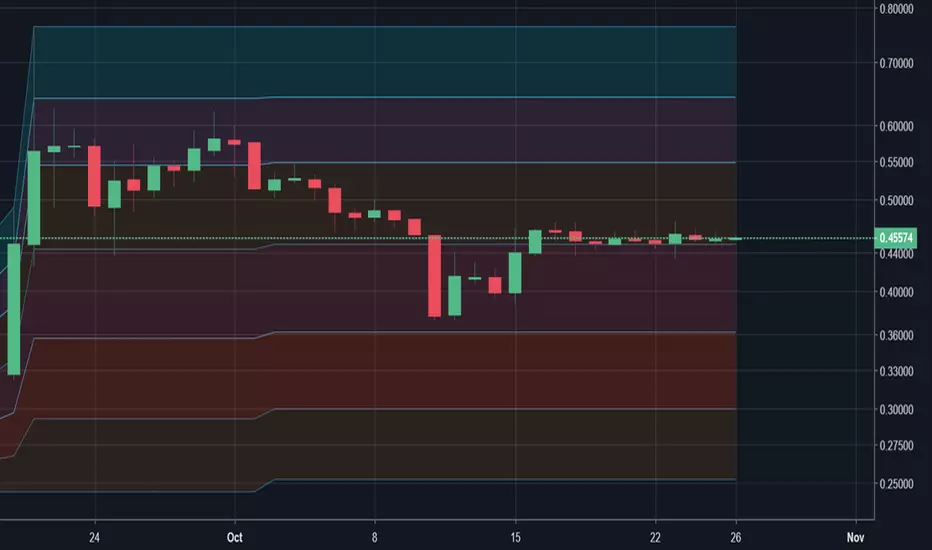
So, the chart above is from the last price analysis that we did with Ripple.
It has been re-posted above for convenience’s sake.
As noted in that chart, 43 cents has held as a very reliable support point for Ripple in recent memory.
There was a brief moment when the price of Ripple touched down around the 37 cent-ish mark before sharply bouncing back up to its current levels at 45–47 cents.
Currently, however, the price of Ripple has been trading along this support with relatively little to no price movement as it continues to consolidate :

Please keep in mind that the above charts were created on the daily resolution.
Now, let’s see what the price action looks like when we can move a bit lower in time to the 2-hour resolution (our favorite as of late for short-term analyses).
2-Hour Ripple XRP Chart
The first thing that we’re going to do here is draw resistance and support points on the chart:

Here, we can see that there was a downtrend resistance that was broken around October 15th (when there was that random spike in the market; same day that Tether broke off of the peg).
The uptrend that was established from that point (after the breaking of that downtrend), has held ever since and the price of RippleXRP is currently nudging against it on the H2.
It’s worth noting that this support is not particularly strong or well-tested and that sharper market forces could easily eviscerate this particular support.
However, 43 cents, as mentioned earlier, is still a very reliable point that should be considered to be the most likely place that RippleXRP’s price would visit if it were to drop in price.

Using a close-up view, it appears that this mini-uptrend support has been preserved fairly well and that the most recent candle formation signifies a bounce off of the line, which would corroborate the idea that it serves as a valid support point.
However, the bounce has not been substantive and it appears that the price of Ripple is adhering heavily to this support point, which is bearish.
Let’s check out some other indicators though, shall we?
Relative Strength Index(14) for RippleXRP

As can be seen on the chart above, the RSI(14) is perhaps as ambiguous as the price data on this chart as well for the 2 hour.
However, the 4–hour data appears to be rock solid at this point in time.
Check it out below:

Moving Fibonacci Levels
This indicator does exactly what it says. It’s also a custom one that was built by the Zerononcense team.
Check it out below:

As noted in the chart above, the price ofXRP is currently floating directly above the Fib resistance level that’s located at 44.84 cents.
Conclusion
We’ll remain neutral for the time being This is one to be observed.
We’re slightly more toward the bearish side on this one, but it remains to be seen what will really happen withXRP as time goes on.
So, the chart above is from the last price analysis that we did with Ripple.
It has been re-posted above for convenience’s sake.
As noted in that chart, 43 cents has held as a very reliable support point for Ripple in recent memory.
There was a brief moment when the price of Ripple touched down around the 37 cent-ish mark before sharply bouncing back up to its current levels at 45–47 cents.
Currently, however, the price of Ripple has been trading along this support with relatively little to no price movement as it continues to consolidate :
Please keep in mind that the above charts were created on the daily resolution.
Now, let’s see what the price action looks like when we can move a bit lower in time to the 2-hour resolution (our favorite as of late for short-term analyses).
2-Hour Ripple
The first thing that we’re going to do here is draw resistance and support points on the chart:
Here, we can see that there was a downtrend resistance that was broken around October 15th (when there was that random spike in the market; same day that Tether broke off of the peg).
The uptrend that was established from that point (after the breaking of that downtrend), has held ever since and the price of Ripple
It’s worth noting that this support is not particularly strong or well-tested and that sharper market forces could easily eviscerate this particular support.
However, 43 cents, as mentioned earlier, is still a very reliable point that should be considered to be the most likely place that Ripple
Using a close-up view, it appears that this mini-uptrend support has been preserved fairly well and that the most recent candle formation signifies a bounce off of the line, which would corroborate the idea that it serves as a valid support point.
However, the bounce has not been substantive and it appears that the price of Ripple is adhering heavily to this support point, which is bearish.
Let’s check out some other indicators though, shall we?
Relative Strength Index(14) for Ripple
As can be seen on the chart above, the RSI(14) is perhaps as ambiguous as the price data on this chart as well for the 2 hour.
However, the 4–hour data appears to be rock solid at this point in time.
Check it out below:
Moving Fibonacci Levels
This indicator does exactly what it says. It’s also a custom one that was built by the Zerononcense team.
Check it out below:
As noted in the chart above, the price of
Conclusion
We’ll remain neutral for the time being This is one to be observed.
We’re slightly more toward the bearish side on this one, but it remains to be seen what will really happen with
Disclaimer
The information and publications are not meant to be, and do not constitute, financial, investment, trading, or other types of advice or recommendations supplied or endorsed by TradingView. Read more in the Terms of Use.
Disclaimer
The information and publications are not meant to be, and do not constitute, financial, investment, trading, or other types of advice or recommendations supplied or endorsed by TradingView. Read more in the Terms of Use.