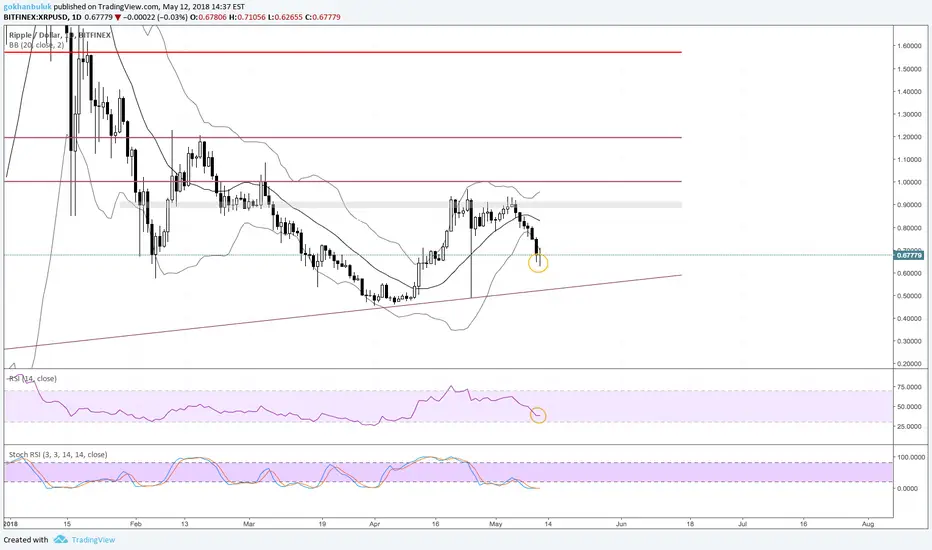
There is positive RSI Divergence on daily and 4hr chart.
If we close above 0.68000 on daily we could go to 0.78-0.80 range.
If we close above 0.68000 on daily we could go to 0.78-0.80 range.
Note
Note
and this is the 4hr chart. There is also positive RSI divergenceTrade closed: target reached
Looks like BTC is falling. Eyes on btc.(If it s a flag we will see 7800-8000 range in btc)
Disclaimer
The information and publications are not meant to be, and do not constitute, financial, investment, trading, or other types of advice or recommendations supplied or endorsed by TradingView. Read more in the Terms of Use.
Disclaimer
The information and publications are not meant to be, and do not constitute, financial, investment, trading, or other types of advice or recommendations supplied or endorsed by TradingView. Read more in the Terms of Use.