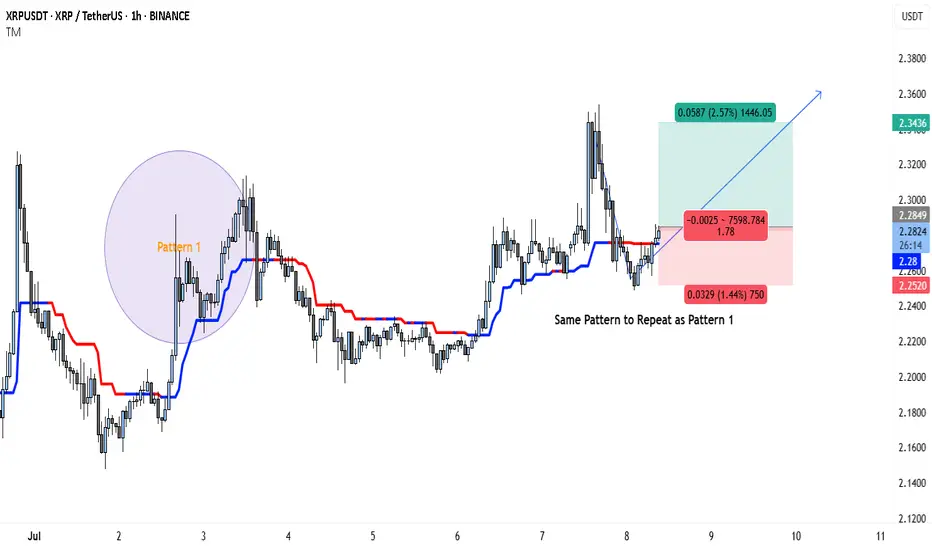
The XRP/USDT 1-hour chart is showing a compelling setup that may mirror a previously bullish price pattern. The left side of the chart highlights Pattern 1, which played out after a period of sideways consolidation followed by a breakout, resulting in a strong upward move. Now, price action is repeating a similar structure with nearly identical conditions forming.
In Pattern 1, XRP consolidated in a tight range, flipped the trend indicator from red to blue (suggesting a momentum shift), and then surged higher. This same transition is occurring again in the current market phase. Price has reclaimed the trend baseline, which has turned blue, hinting at growing buyer strength.
The idea here is that XRP could be preparing for another impulsive move to the upside, identical to what happened before. The setup is visually marked with a trade box showing entry, stop-loss, and target levels.
Trade Idea Based on Current Pattern
• Entry: 2.2849
• Target: 2.3436
• Stop-loss: 2.2520
• Reward-to-Risk (R:R): ≈ 1.78
• Potential Gain: 2.57%
• Potential Loss: 1.44%
The structure favors a long position, as long as the price holds above the 2.25–2.26 support range. A break below this could invalidate the setup and trigger the stop-loss. If the breakout is confirmed with volume, XRP could move rapidly toward the 2.34 level and possibly beyond.
This kind of fractal behavior, where patterns repeat themselves in similar market conditions, is common in crypto. With the trend indicator already flipping bullish and price forming higher lows, the probability of continuation looks solid—especially for short-term traders.
As always, trade with proper risk management, and be cautious of volatility that can trigger stop-hunts in tightly ranged zones.
Trade forex, indices, stocks and metals with up to US$100.000 in company's funding.
Complete a challenge to access funding or go for instant deposit.
Trading involves substantial risk. Not financial advice
Complete a challenge to access funding or go for instant deposit.
Trading involves substantial risk. Not financial advice
Related publications
Disclaimer
The information and publications are not meant to be, and do not constitute, financial, investment, trading, or other types of advice or recommendations supplied or endorsed by TradingView. Read more in the Terms of Use.