The 4-hour chart of 
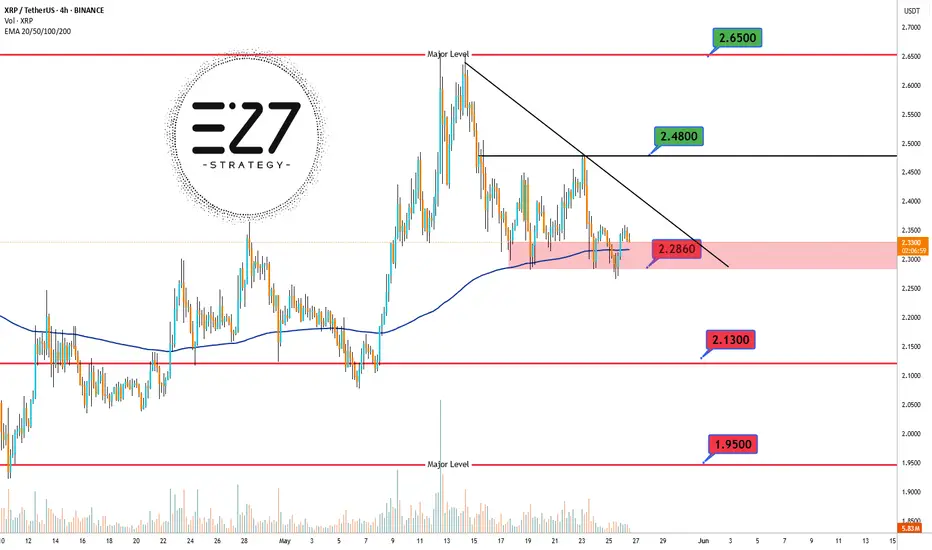
 XRPUSDT shows that the overall trend remains bullish, but the price is currently in a corrective downward phase. 📉 At the moment, XRP is trading in a highly critical zone, right at the 2.2860 USDT support level, which aligns with the 200 EMA — often considered a dynamic support area. 🛡️ Despite this confluence, the price still sits below the descending trendline, indicating continued bearish pressure. ⚠️ If the price manages to hold this key zone and break above the trendline, a move toward the next resistance at 2.4800 USDT and potentially 2.6500 USDT could follow. 🚀 However, losing the 2.2860 support could trigger a deeper drop toward 2.1300 USDT and even 1.9500 USDT. ❗ This current level, where static support intersects with the 200 EMA, is a make-or-break zone that will likely define the short-term direction of XRP.
- Support & Resistance Levels:
- 🔼 Major Resistance: 2.6500 USDT
- 🔼 Secondary Resistance: 2.4800 USDT
- ⚡ Dynamic Resistance (trendline): ~2.3500 USDT
- 🔽 Key Support (current price level): 2.2860 USDT
- 🔽 Secondary Support: 2.1300 USDT
- 🔽 Major Support: 1.9500 USDT
Related publications
Disclaimer
The information and publications are not meant to be, and do not constitute, financial, investment, trading, or other types of advice or recommendations supplied or endorsed by TradingView. Read more in the Terms of Use.
Related publications
Disclaimer
The information and publications are not meant to be, and do not constitute, financial, investment, trading, or other types of advice or recommendations supplied or endorsed by TradingView. Read more in the Terms of Use.