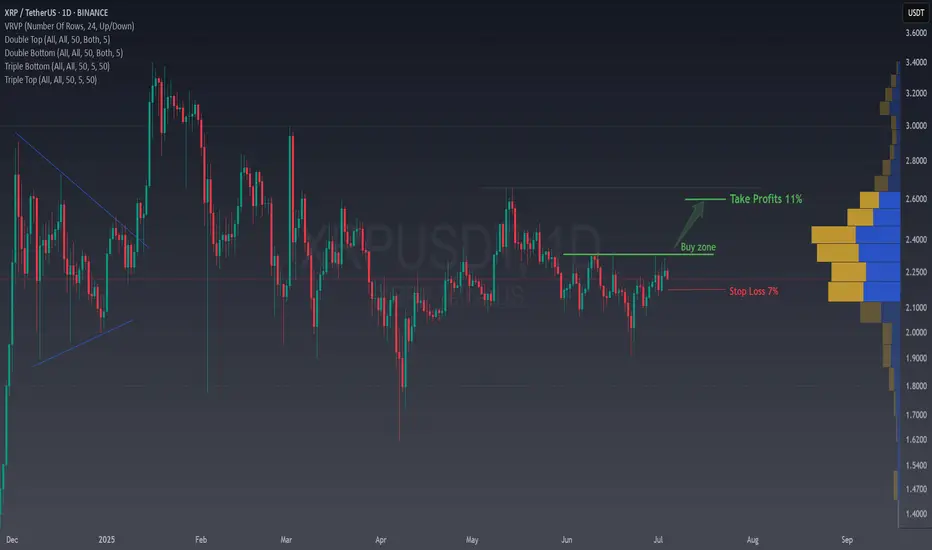
✅ 1. Buy Zone Identified
The “Buy zone” is a green area where the price has recently been consolidating (moving sideways).
💡 If the price breaks above this level or shows strength here, it could be a good opportunity to enter a long (buy) trade.
🎯 2. Take Profit Target: +11%
The “Take Profits” line above the buy zone suggests a potential 11% upside.
This is where you might want to sell your position and lock in gains if the price moves in your favor.
🛑 3. Stop Loss: -7%
The “Stop Loss” is clearly marked below the buy zone, with a 7% risk.
This is your safety net, if the price falls to this level, the trade automatically closes to prevent further loss.
📦 4. Volume Profile (on the right side)
The blue and yellow bars show the Volume Profile, which highlights price levels where most trading activity happened.
🔹 The cluster near the buy zone means there was strong interest in this area — it could act as a support zone.
🚀 Simple Summary
The chart shows a bullish setup for XRP/USDT.
- There’s a clear Buy zone where price is trying to break higher.
- The profit target is +11%, and the stop loss is -7%.
- Volume data supports this as an important price zone.
Disclaimer
The information and publications are not meant to be, and do not constitute, financial, investment, trading, or other types of advice or recommendations supplied or endorsed by TradingView. Read more in the Terms of Use.
Disclaimer
The information and publications are not meant to be, and do not constitute, financial, investment, trading, or other types of advice or recommendations supplied or endorsed by TradingView. Read more in the Terms of Use.