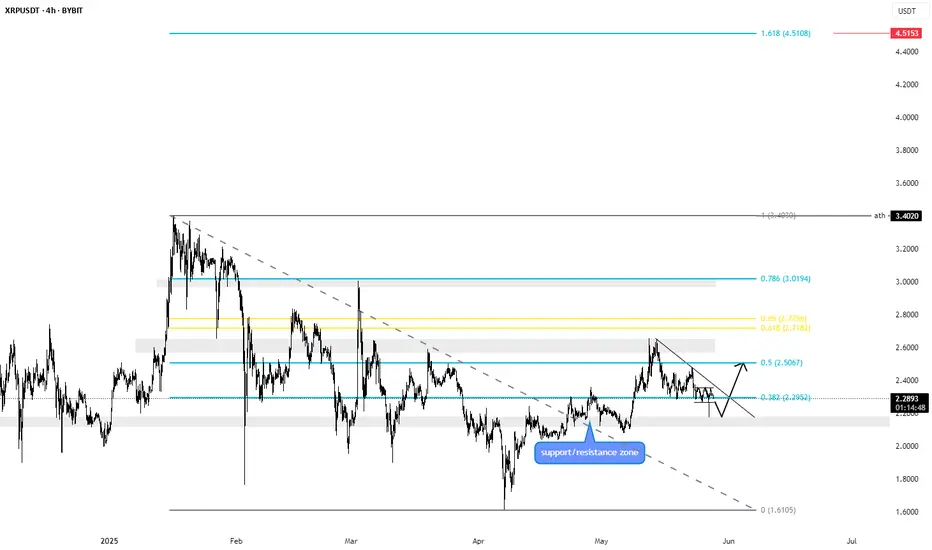
XRP shows a triple top on the 4h chart which is a strong bearish pattern. If we are going to play this, this nicely matches the testing of a previous resistance/support zone. which we are now going to test again. If we manage to convert it into support and we break the trendline, the way is clear to the 1.618 fibbonachi level, which amounts to a value of approximately 4.5 usdt. tradingview.com/chart/2QfRkkZO/ tradingview.com/chart/2QfRkkZO/
Disclaimer
The information and publications are not meant to be, and do not constitute, financial, investment, trading, or other types of advice or recommendations supplied or endorsed by TradingView. Read more in the Terms of Use.
Disclaimer
The information and publications are not meant to be, and do not constitute, financial, investment, trading, or other types of advice or recommendations supplied or endorsed by TradingView. Read more in the Terms of Use.