Hello traders!
If you "Follow" us, you can always get new information quickly.
Please also click “Boost”.
Have a good day.
-------------------------------------
(XRPUSDT chart)

(1M charts)

If the price maintains by rising above 0.6810, it is expected to lead to a move to rise above 0.9413.
(1W chart)

Accordingly, if it rises above 0.7046, it is expected to show a rapid upward trend.
The key is whether this upward trend can rise to the 0.9470-1.2455 range.
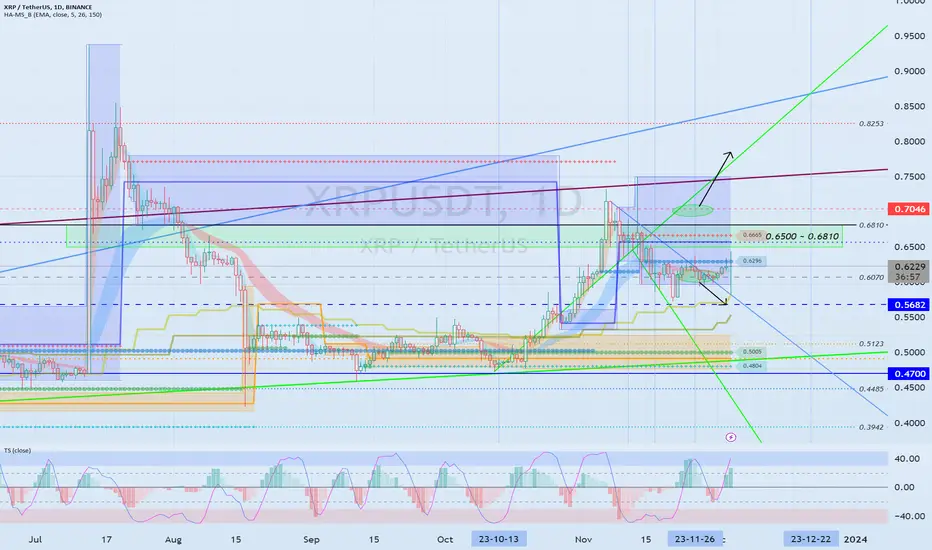
(1D chart)

The price appears to be maintaining in the box range of 0.5967-0.7500.
Accordingly, the key is whether it can rise above 0.6500-0.6810.

If the price rises above 0.6383 and holds, I think there is a high possibility that an uptrend will begin.
The next period of volatility is around December 22nd.
--------------------------------------------------
- The big picture

The full-fledged upward trend is expected to begin when the price rises above 29K.
This is the section expected to be touched in the next bull market, 81K-95K.
-------------------------------------------------- -------------------------------------------
** All explanations are for reference only and do not guarantee profit or loss in investment.
** Trading volume is displayed as a candle body based on 10EMA.
How to display (in order from darkest to darkest)
More than 3 times the trading volume of 10EMA > 2.5 times > 2.0 times > 1.25 times > Trading volume below 10EMA
** Even if you know other people’s know-how, it takes a considerable amount of time to make it your own.
** This chart was created using my know-how.
---------------------------------
If you "Follow" us, you can always get new information quickly.
Please also click “Boost”.
Have a good day.
-------------------------------------
(XRPUSDT chart)
(1M charts)
If the price maintains by rising above 0.6810, it is expected to lead to a move to rise above 0.9413.
(1W chart)
Accordingly, if it rises above 0.7046, it is expected to show a rapid upward trend.
The key is whether this upward trend can rise to the 0.9470-1.2455 range.
(1D chart)
The price appears to be maintaining in the box range of 0.5967-0.7500.
Accordingly, the key is whether it can rise above 0.6500-0.6810.
If the price rises above 0.6383 and holds, I think there is a high possibility that an uptrend will begin.
The next period of volatility is around December 22nd.
--------------------------------------------------
- The big picture
The full-fledged upward trend is expected to begin when the price rises above 29K.
This is the section expected to be touched in the next bull market, 81K-95K.
-------------------------------------------------- -------------------------------------------
** All explanations are for reference only and do not guarantee profit or loss in investment.
** Trading volume is displayed as a candle body based on 10EMA.
How to display (in order from darkest to darkest)
More than 3 times the trading volume of 10EMA > 2.5 times > 2.0 times > 1.25 times > Trading volume below 10EMA
** Even if you know other people’s know-how, it takes a considerable amount of time to make it your own.
** This chart was created using my know-how.
---------------------------------
Other content (coins, stocks, etc.) is frequently posted on X.
X에 다른 내용(코인, 주식 등)이 자주 게시.
◆ t.me/readCryptoChannel
[HA-MS Indicator]
bit.ly/3YxHgvN
[OBV Indicator]
bit.ly/4dcyny3
X에 다른 내용(코인, 주식 등)이 자주 게시.
◆ t.me/readCryptoChannel
[HA-MS Indicator]
bit.ly/3YxHgvN
[OBV Indicator]
bit.ly/4dcyny3
Related publications
Disclaimer
The information and publications are not meant to be, and do not constitute, financial, investment, trading, or other types of advice or recommendations supplied or endorsed by TradingView. Read more in the Terms of Use.