Hello everyone, let's take a look at charting the XRP to USDT over a 4 hour timeframe.
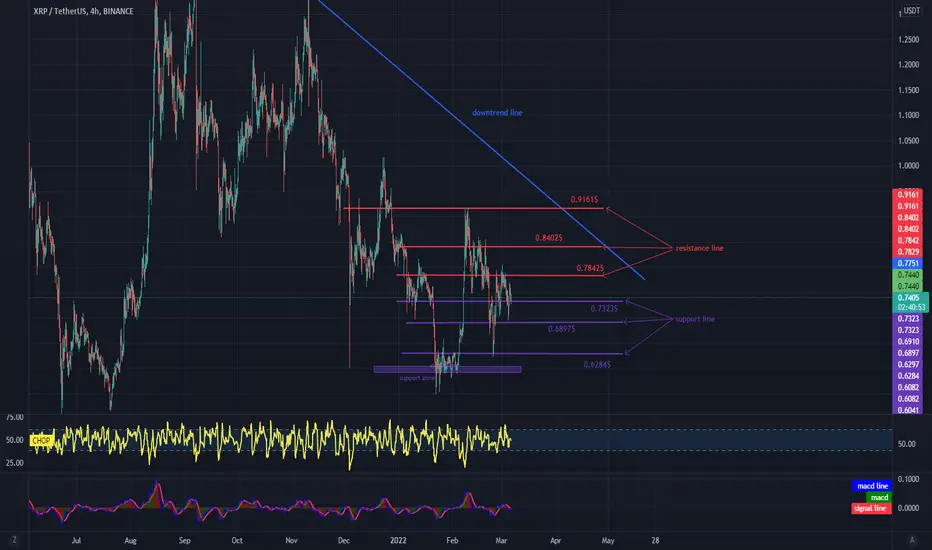
Let's start by drawing a downtrend line at which price is constantly moving.
Now let's move to the support line, as you can see, the first support is around $ 0.7323 where the price crosses, the next support is $ 0.6897, $ 0.6284, then we have a support zone from $ 0.60 to $ 0.58.
Looking the other way, it is worth determining the resistance that we have to overcome and we see that the first resistance is at the level of $ 0.7842, the next resistance is the so-called Gold Fib point 0.618 at $ 0.8402 and another resistance at $ 0.9161.
It's worth paying attention to the CHOP indicator which shows that we recovered some energy after the last move.
Disclaimer
The information and publications are not meant to be, and do not constitute, financial, investment, trading, or other types of advice or recommendations supplied or endorsed by TradingView. Read more in the Terms of Use.
Disclaimer
The information and publications are not meant to be, and do not constitute, financial, investment, trading, or other types of advice or recommendations supplied or endorsed by TradingView. Read more in the Terms of Use.