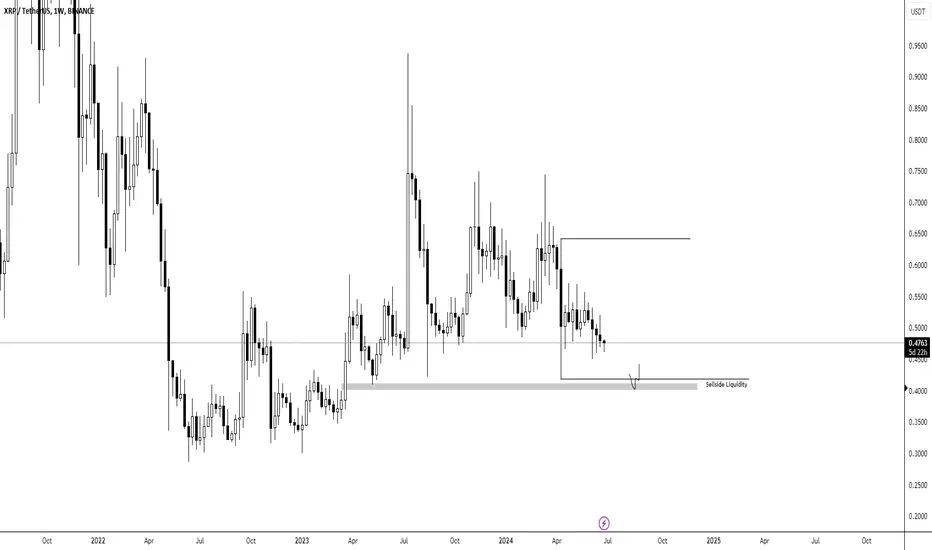
Key Levels:
Sellside Liquidity Zone:
shaded gray area indicating a potential support level where sell orders may be concentrated.
Resistance Level: horizontal line drawn around the $0.65 mark, suggesting a significant resistance level based on past price actions.
Sellside Liquidity Zone:
shaded gray area indicating a potential support level where sell orders may be concentrated.
Resistance Level: horizontal line drawn around the $0.65 mark, suggesting a significant resistance level based on past price actions.
Trade active
XRP has just hit the range low. We are long!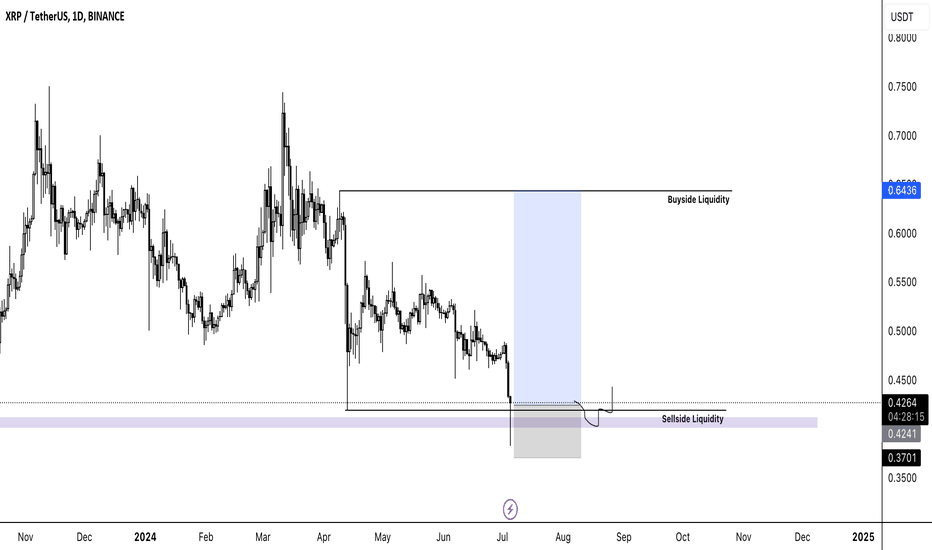
Note
Target almost hit💎💎- Professional Trader
💎💎 - Discord: discord.gg/gHKNVMyEvd
💎💎 - Trading Course: liquiditysweep369.carrd.co/
💎💎 - Discord: discord.gg/gHKNVMyEvd
💎💎 - Trading Course: liquiditysweep369.carrd.co/
Disclaimer
The information and publications are not meant to be, and do not constitute, financial, investment, trading, or other types of advice or recommendations supplied or endorsed by TradingView. Read more in the Terms of Use.
💎💎- Professional Trader
💎💎 - Discord: discord.gg/gHKNVMyEvd
💎💎 - Trading Course: liquiditysweep369.carrd.co/
💎💎 - Discord: discord.gg/gHKNVMyEvd
💎💎 - Trading Course: liquiditysweep369.carrd.co/
Disclaimer
The information and publications are not meant to be, and do not constitute, financial, investment, trading, or other types of advice or recommendations supplied or endorsed by TradingView. Read more in the Terms of Use.