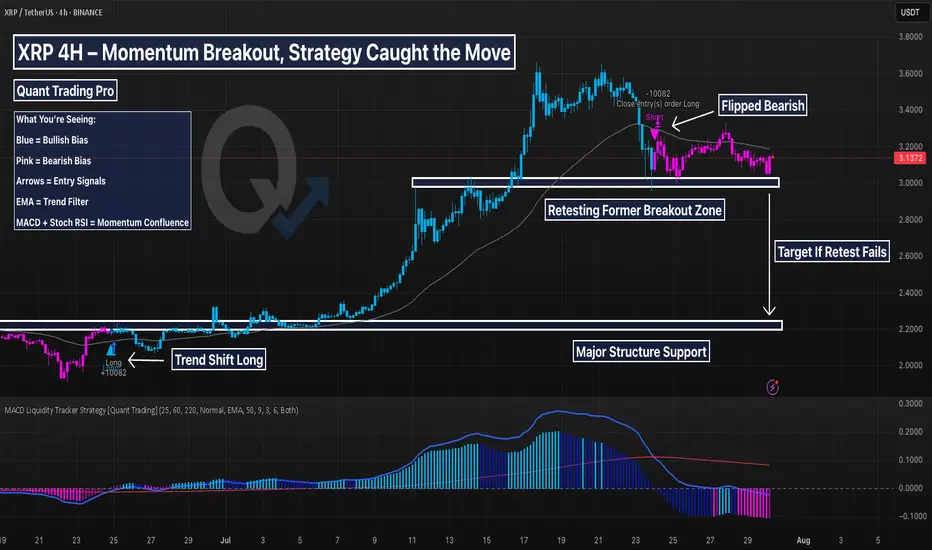
This XRP chart is a textbook example of the MACD Liquidity Tracker Strategy in action. After flipping bullish in late June, the system triggered a clean long and stayed in the move for over 100% before flipping bearish near the local top.
The system didn’t chase or guess — it followed clear logic:
MACD momentum confirmed
Trend aligned with EMA
State flipped blue → long triggered
Exit near top when momentum shifted
Now, XRP is in a bearish state, retesting its prior breakout zone. The MACD histogram remains below zero, and price is below the trend filter — indicating caution. But this is exactly where strategy traders prep for reversals or continuation.
🔍 Highlights:
Clean +100% trend catch
Momentum shift = smooth exit
Currently respecting support = decision zone
Still in “wait” mode — no guessing
This system shines when volatility expands. Perfect for trend traders who want clarity and control — and ideal to backtest.
Try our strategy optimizer at quanttradingpro.com
Developing free strategies weekly stay tuned...
Join our discord discord.gg/2systG9frc
We provide education & tools.
Developing free strategies weekly stay tuned...
Join our discord discord.gg/2systG9frc
We provide education & tools.
Disclaimer
The information and publications are not meant to be, and do not constitute, financial, investment, trading, or other types of advice or recommendations supplied or endorsed by TradingView. Read more in the Terms of Use.