XRP/USDT Bullish Breakout Anticipation 🚀
Technical Analysis:
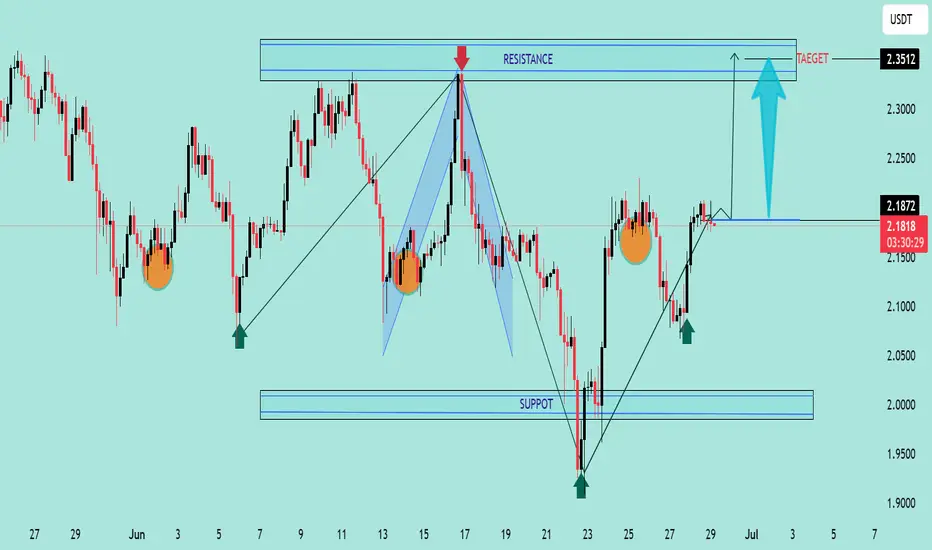
The chart illustrates a potential bullish setup for XRP/USDT based on price structure, support/resistance levels, and harmonic movements.
🔍 Key Observations:
Rejection From Major Support Zone (1.95 - 2.00):
Price previously tested a strong demand zone (marked as “SUPPORT”) and showed significant rejection with bullish candlestick momentum.
Series of Higher Lows ✅:
The price structure shows consecutive higher lows (green arrows), indicating rising buying pressure and bullish intent.
Break of Intermediate Resistance (2.15 - 2.18):
A breakout from the neckline area confirms bullish continuation. Price is currently retesting this level, turning resistance into support.
Target Zone at 2.35 - 2.36 🟦:
A clean target area marked by historical resistance and previous high (red arrow).
Projection indicates a possible move toward 2.3512 USDT, aligning with the measured move from the breakout structure.
Bullish Harmonic Pattern Completion 🔼:
The chart also displays a harmonic pattern completion near the recent low, suggesting a reversal point aligning with market reaction.
🎯 Trading Plan:
Entry Zone: Current retest around 2.15 - 2.18 is favorable.
Target: 2.3512 (as per projection and prior resistance zone).
Invalidation: Break below 2.10 and especially under the key support (2.00) would invalidate the setup.
📌 XRP/USDT is showing bullish strength as long as it holds above the breakout level. A sustained move could trigger momentum towards the 2.35 target zone. 💪📊
Technical Analysis:
The chart illustrates a potential bullish setup for XRP/USDT based on price structure, support/resistance levels, and harmonic movements.
🔍 Key Observations:
Rejection From Major Support Zone (1.95 - 2.00):
Price previously tested a strong demand zone (marked as “SUPPORT”) and showed significant rejection with bullish candlestick momentum.
Series of Higher Lows ✅:
The price structure shows consecutive higher lows (green arrows), indicating rising buying pressure and bullish intent.
Break of Intermediate Resistance (2.15 - 2.18):
A breakout from the neckline area confirms bullish continuation. Price is currently retesting this level, turning resistance into support.
Target Zone at 2.35 - 2.36 🟦:
A clean target area marked by historical resistance and previous high (red arrow).
Projection indicates a possible move toward 2.3512 USDT, aligning with the measured move from the breakout structure.
Bullish Harmonic Pattern Completion 🔼:
The chart also displays a harmonic pattern completion near the recent low, suggesting a reversal point aligning with market reaction.
🎯 Trading Plan:
Entry Zone: Current retest around 2.15 - 2.18 is favorable.
Target: 2.3512 (as per projection and prior resistance zone).
Invalidation: Break below 2.10 and especially under the key support (2.00) would invalidate the setup.
📌 XRP/USDT is showing bullish strength as long as it holds above the breakout level. A sustained move could trigger momentum towards the 2.35 target zone. 💪📊
JOIN MY TELEGRAM CHANNEL
t.me/StellarMarketAnalysis
JOIN MY RECOMMENTED BROKER REFFREL LINK
⤵️one.exnesstrack.net/a/uvd1etcgg1
PARTNER CODE⤵️
uvd1etcgg1
t.me/StellarMarketAnalysis
JOIN MY RECOMMENTED BROKER REFFREL LINK
⤵️one.exnesstrack.net/a/uvd1etcgg1
PARTNER CODE⤵️
uvd1etcgg1
Disclaimer
The information and publications are not meant to be, and do not constitute, financial, investment, trading, or other types of advice or recommendations supplied or endorsed by TradingView. Read more in the Terms of Use.