Hello traders!
If you "Follow" us, you can always get new information quickly.
Please also click “Boost”.
Have a good day.
-------------------------------------
(XRPUSDT chart)

(1M charts)

If the price remains above 0.47, it is expected to continue its upward trend.
Since the volume profile section is formed around 1.0409, when the rise begins,
1st: 1.1248-1.3083
2nd: 1.9023
It is expected to rise to around the 1st and 2nd levels above.
Accordingly, the area around 1.0409 corresponds to an important support and resistance area.
(1W chart)

The HA-High indicator fell and broke out of the previous box, a major resistance zone in the 0.65-1.7050 range.
Accordingly, the key is whether it can rise from the current box range of 0.4226-0.6369 and rise above 0.7046.
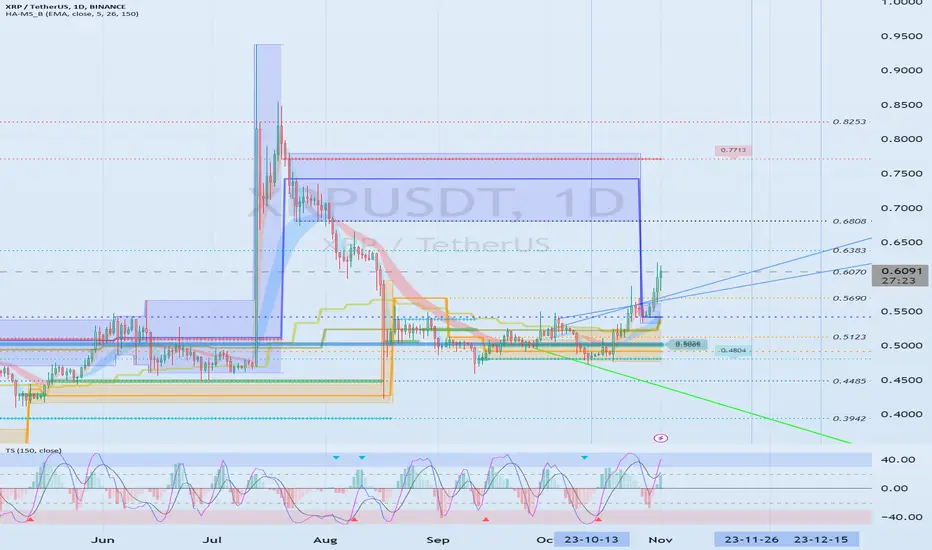
(1D chart)


The key is whether it can receive support around 0.6070 and rise to the box range of 0.6808-0.7799.
If not, you should check for support around 0.5416-0.5690.
If support is confirmed around 0.5416-0.5690, it is expected to form a pull back pattern and rise.
--------------------------------------------------
- The big picture

The full-fledged upward trend is expected to begin when the price rises above 29K.
This is the section expected to be touched in the next bull market, 81K-95K.
-------------------------------------------------- -------------------------------------------
** All explanations are for reference only and do not guarantee profit or loss in investment.
** Trading volume is displayed as a candle body based on 10EMA.
How to display (in order from darkest to darkest)
More than 3 times the trading volume of 10EMA > 2.5 times > 2.0 times > 1.25 times > Trading volume below 10EMA
** Even if you know other people’s know-how, it takes a considerable amount of time to make it your own.
** This chart was created using my know-how.
---------------------------------
If you "Follow" us, you can always get new information quickly.
Please also click “Boost”.
Have a good day.
-------------------------------------
(XRPUSDT chart)
(1M charts)
If the price remains above 0.47, it is expected to continue its upward trend.
Since the volume profile section is formed around 1.0409, when the rise begins,
1st: 1.1248-1.3083
2nd: 1.9023
It is expected to rise to around the 1st and 2nd levels above.
Accordingly, the area around 1.0409 corresponds to an important support and resistance area.
(1W chart)
The HA-High indicator fell and broke out of the previous box, a major resistance zone in the 0.65-1.7050 range.
Accordingly, the key is whether it can rise from the current box range of 0.4226-0.6369 and rise above 0.7046.
(1D chart)
The key is whether it can receive support around 0.6070 and rise to the box range of 0.6808-0.7799.
If not, you should check for support around 0.5416-0.5690.
If support is confirmed around 0.5416-0.5690, it is expected to form a pull back pattern and rise.
--------------------------------------------------
- The big picture
The full-fledged upward trend is expected to begin when the price rises above 29K.
This is the section expected to be touched in the next bull market, 81K-95K.
-------------------------------------------------- -------------------------------------------
** All explanations are for reference only and do not guarantee profit or loss in investment.
** Trading volume is displayed as a candle body based on 10EMA.
How to display (in order from darkest to darkest)
More than 3 times the trading volume of 10EMA > 2.5 times > 2.0 times > 1.25 times > Trading volume below 10EMA
** Even if you know other people’s know-how, it takes a considerable amount of time to make it your own.
** This chart was created using my know-how.
---------------------------------
Note
(XRPUSDT 1D chart)From a long-term perspective, a full-fledged uptrend began with support above 0.47.
The key is whether it can receive support and rise at the 0.6070 point, which is the next most important point after the 0.47 point.
Note
(XRPUSDT chart)The next period of volatility is expected to begin around November 11th.
Note
All charts are showing an upward trend.
Since it has currently entered an important support and resistance zone, it is expected to surge if it rises above 0.7046-0.7143.
Note
#XRPUSDT #XRPThe key is whether it can receive support in the box range of 0.5967-0.7500 and rise above 0.7799.
Other content (coins, stocks, etc.) is frequently posted on X.
X에 다른 내용(코인, 주식 등)이 자주 게시.
◆ t.me/readCryptoChannel
[HA-MS Indicator]
bit.ly/3YxHgvN
[OBV Indicator]
bit.ly/4dcyny3
X에 다른 내용(코인, 주식 등)이 자주 게시.
◆ t.me/readCryptoChannel
[HA-MS Indicator]
bit.ly/3YxHgvN
[OBV Indicator]
bit.ly/4dcyny3
Related publications
Disclaimer
The information and publications are not meant to be, and do not constitute, financial, investment, trading, or other types of advice or recommendations supplied or endorsed by TradingView. Read more in the Terms of Use.