XTI/USD is currently exhibiting bearish technical signals, with key indicators pointing towards potential further declines. However, the presence of oversold conditions suggests that a short-term rebound could occur if prices find support at current levels. Traders should monitor the $60.13 support and $61.38 resistance levels closely, as breaks of these levels could signal the next directional move.
XTI/USD is experiencing a noticeable downward shift in market sentiment. After a period of relative stability, prices have started to decline, influenced primarily by concerns over global demand and shifting geopolitical conditions. Despite earlier support from tensions in Eastern Europe and U.S. sanctions on Russian energy exports, the market now appears to be reacting more to economic headwinds, such as signs of slowing industrial growth in major economies like China and the Eurozone. Traders are closely watching whether current support levels will hold or if the recent downward momentum will lead to a deeper correction. Overall, the sentiment leans cautious, with traders waiting for clearer signals from both supply-side developments and macroeconomic indicators.
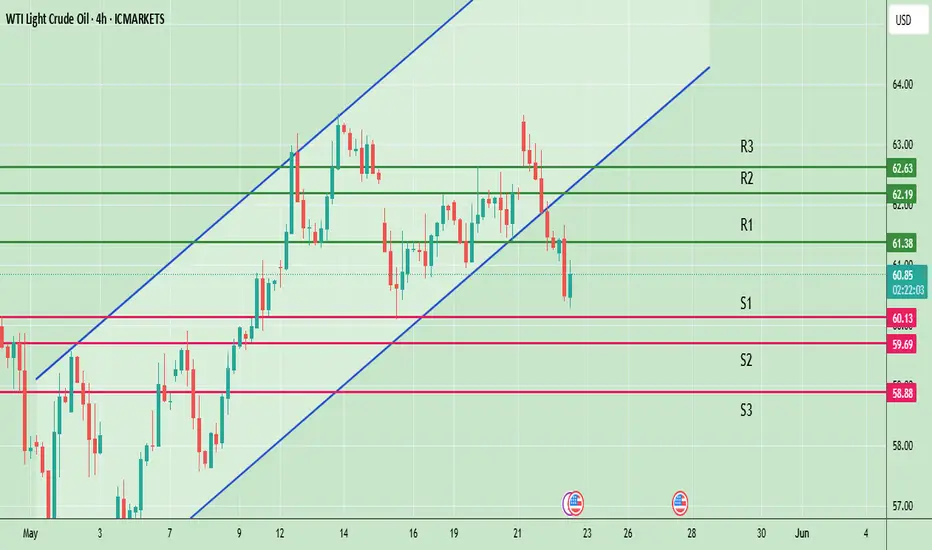
Pivot Points:
Support Levels: S1 at $60.13, S2 at $59.69, S3 at $58.88.
Resistance Levels: R1 at $61.38, R2 at $62.19, R3 at $62.63.
Bearish Outlook
Trigger: A break below the $60.13 support level.
Targets: $59.69 followed by $58.88
Invalidation: A decisive move above the $61.38 resistance level.
Bullish Outlook
Trigger: A sustained break above the $61.38 resistance level.
Targets: $62.19 followed by $62.63
Invalidation: A drop below the $60.13 support level.
Note
Please risk management in trading is a Key so use your money accordingly. If you like the idea then please like and boost. Thank you and Good Luck!
XTI/USD is experiencing a noticeable downward shift in market sentiment. After a period of relative stability, prices have started to decline, influenced primarily by concerns over global demand and shifting geopolitical conditions. Despite earlier support from tensions in Eastern Europe and U.S. sanctions on Russian energy exports, the market now appears to be reacting more to economic headwinds, such as signs of slowing industrial growth in major economies like China and the Eurozone. Traders are closely watching whether current support levels will hold or if the recent downward momentum will lead to a deeper correction. Overall, the sentiment leans cautious, with traders waiting for clearer signals from both supply-side developments and macroeconomic indicators.
Pivot Points:
Support Levels: S1 at $60.13, S2 at $59.69, S3 at $58.88.
Resistance Levels: R1 at $61.38, R2 at $62.19, R3 at $62.63.
Bearish Outlook
Trigger: A break below the $60.13 support level.
Targets: $59.69 followed by $58.88
Invalidation: A decisive move above the $61.38 resistance level.
Bullish Outlook
Trigger: A sustained break above the $61.38 resistance level.
Targets: $62.19 followed by $62.63
Invalidation: A drop below the $60.13 support level.
Note
Please risk management in trading is a Key so use your money accordingly. If you like the idea then please like and boost. Thank you and Good Luck!
Disclaimer
The information and publications are not meant to be, and do not constitute, financial, investment, trading, or other types of advice or recommendations supplied or endorsed by TradingView. Read more in the Terms of Use.
Disclaimer
The information and publications are not meant to be, and do not constitute, financial, investment, trading, or other types of advice or recommendations supplied or endorsed by TradingView. Read more in the Terms of Use.