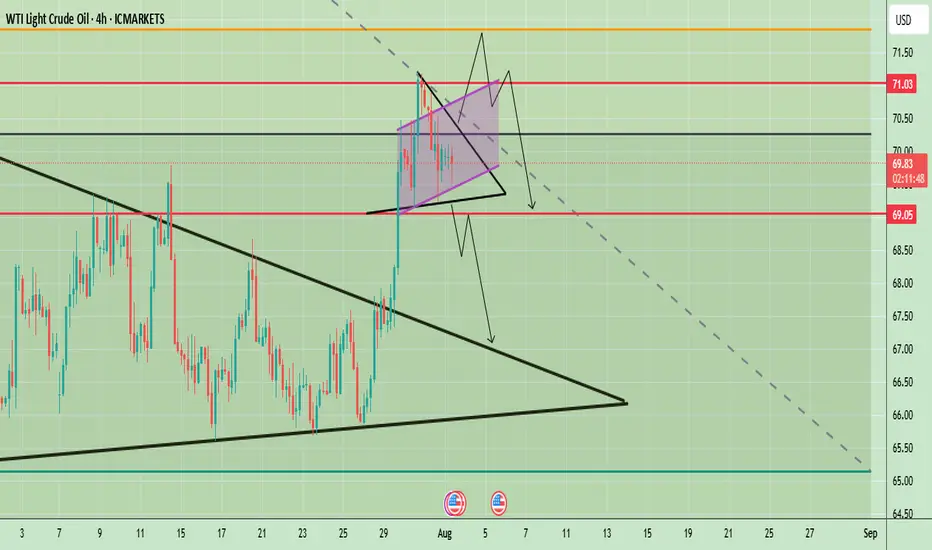
WTI Crude Oil 4-hour chart suggests a potential inflection point after a strong bullish breakout from a larger symmetrical triangle pattern in late July. The price surged past key resistance levels and is now consolidating in a smaller symmetrical triangle formation just below the psychological $70 mark. This indicates a phase of indecision following a strong move, with market participants awaiting further confirmation.
Price is currently hovering around $69.82, with key levels marked at $71.03 (resistance) and $69.05 (support). The short-term price action within the tight triangle could determine the next move, with both bullish continuation and bearish reversal scenarios on the table.
Prices remain supported by supply concerns after Trump threatened to impose 100% secondary tariffs on buyers of Russian crude and warned China, a major oil consumer of severe penalties if it continues its purchases of Russian oil.
🔍 Potential Scenarios
- Bullish Breakout Scenario
If price breaks out of the smaller symmetrical triangle to the upside and clears the $70 resistance level with strong momentum, it may quickly test the $71.03 zone. A clean break above $71.03 would confirm the continuation of the previous uptrend, potentially opening room toward $72.50 and beyond in the medium term. The pattern would resemble a bullish pennant — a continuation pattern following the late July rally.
-Bearish Rejection and Breakdown
Conversely, a failure to sustain above $70 followed by a break below the lower boundary of the smaller triangle could lead to a sharper decline. The first critical level to watch would be $69.05; a break below this would likely invalidate the bullish setup and initiate a retest of the previously broken upper trendline of the larger triangle near $67.50. A further breakdown could lead price towards the larger support zone around $65–$66.
📈 Trend Outlook
- Short-Term: Neutral to Bullish — Consolidation in a smaller symmetrical triangle suggests a pause before continuation. However, the structure is still technically bullish unless $69.05 is broken.
- Medium-Term: Bullish Bias — The breakout from the large symmetrical triangle in late July indicates a shift in market sentiment, favoring higher prices unless the price fails to hold above $67.50.
- Long-Term: Cautiously Bullish — As long as WTI holds above the $65–$66 structural support area, the longer-term outlook remains constructive.
Note
Please risk management in trading is a Key so use your money accordingly. If you like the idea then please like and boost. Thank you and Good Luck!
Disclaimer
The information and publications are not meant to be, and do not constitute, financial, investment, trading, or other types of advice or recommendations supplied or endorsed by TradingView. Read more in the Terms of Use.
Disclaimer
The information and publications are not meant to be, and do not constitute, financial, investment, trading, or other types of advice or recommendations supplied or endorsed by TradingView. Read more in the Terms of Use.