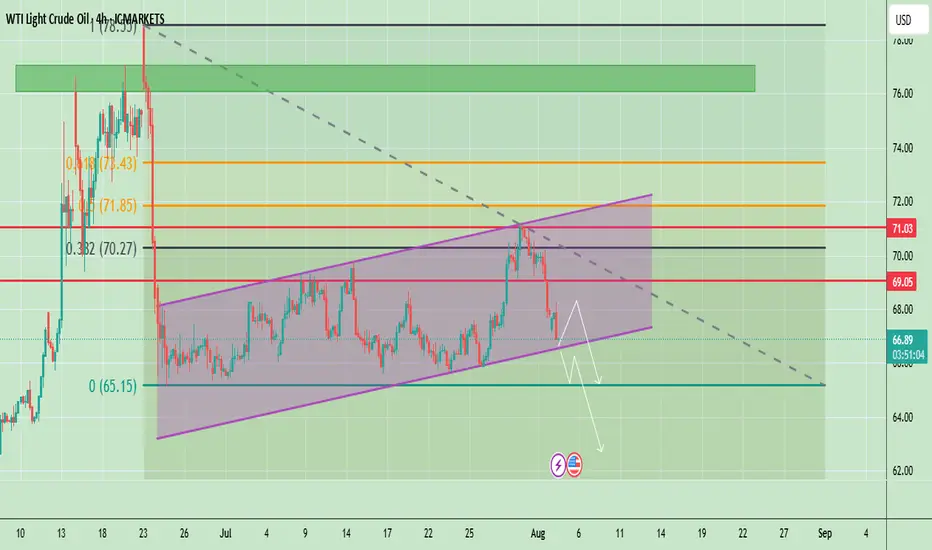
Crude oil is trading around $66.94, showing a bearish correction after failing to hold above $69.05. The chart shows price respecting an ascending channel but currently testing its lower boundary. The recent drop signals weakening bullish momentum, and a confirmed break below the channel could accelerate selling pressure toward lower levels.
📈 Potential Scenarios
- Bullish Rebound: If price holds above the channel support (~$66.00–$66.50) and breaks back above $69.05, it may target $71.03 and possibly $72.00.
- Bearish Breakdown: A confirmed close below $66.00 can accelerate the downside toward $65.00, with extended targets near $63.50–$62.00.
📊 Key Technical Highlights
- Price rejected from the channel top and is now testing lower support.
- Key resistance zones: $69.05 (immediate), $71.03 (major).
- Key support zones: $66.00 (channel), then $65.00–$63.50 (breakdown targets).
- Momentum indicators show weakening buying pressure, favoring cautious trading.
🔑 Key Levels to Watch
- Resistance: $69.05 → $71.03 → $72.00
- Support: $66.00 → $65.00 → $63.50
🧭 Trend Outlook
- A short-term relief bounce is possible, but failure to reclaim $69.05 keeps sellers in control.
- Breaking below the channel would shift the overall outlook to bearish for August.
Note
Please risk management in trading is a Key so use your money accordingly. If you like the idea then please like and boost. Thank you and Good Luck!
Trade active
Oil immediate support is at 65.50 – 65.00, and a break below could extend weakness toward 63.80 – 63.00. Short-term bias remains neutral, but momentum may turn bullish if price holds above 65.50 and breaks 67.50.
On the upside key resistance lies at 67.00 – 67.50, and a breakout above this zone could open the way toward 68.40 – 69.00.
Disclaimer
The information and publications are not meant to be, and do not constitute, financial, investment, trading, or other types of advice or recommendations supplied or endorsed by TradingView. Read more in the Terms of Use.
Disclaimer
The information and publications are not meant to be, and do not constitute, financial, investment, trading, or other types of advice or recommendations supplied or endorsed by TradingView. Read more in the Terms of Use.