*swing trade opportunity*
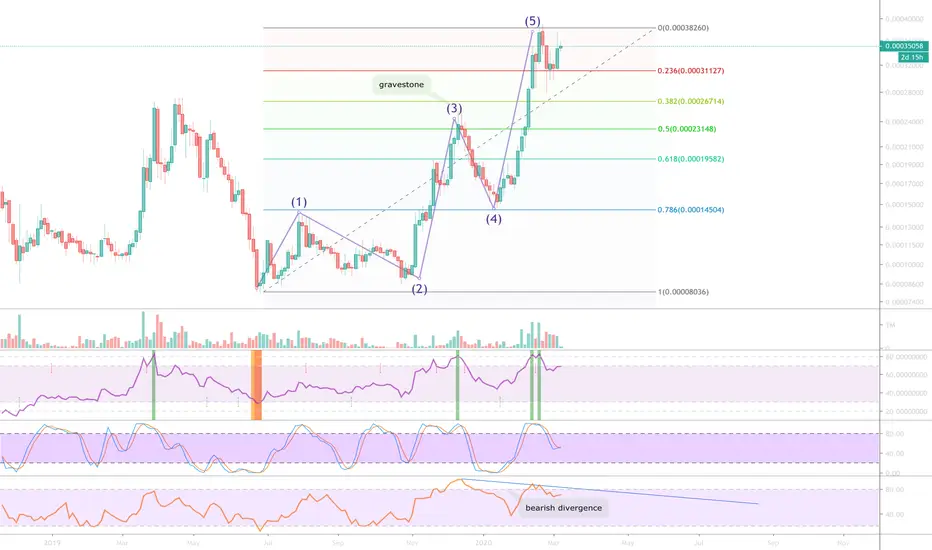
3-day displaying Elliot wave pattern with evidence of trend reversal. Divergence is also evident between price action and money flow. On the 1-day chart RSI support has been followed since June 2019, it is now acting as resistance. Clearer picture below. Expecting 40 & 60% drops to 20 & 15 sats, respectively, from current price action.
1-day chart showing failed RSI support
Note
So far so good.. think we're almost at the end of the Elliot correction wave A, but I'll stay out until we're at the end of wave C myself.Note
The bearish divergence is now very clear to see - could be a few months if not more before this correction is over.Trade closed: target reached
Was expecting 60% correction, got 80%! Time to rotate back into Tezos.Of the few alt-coins on the 4-day chart Tezos is one of those that has printed a Dragonfly DOJI candle indicating a strong reversal is about to occur following the oversold condition (orange column).
Well done if you managed to stay short until now.
BTC
bc1q2eckdzh0q8vsd7swcc8et6ze7s99khhxyl7zwy
Weblink: patreon.com/withoutworries
Allow 3-6 months on ideas. Not investment advice. DYOR
bc1q2eckdzh0q8vsd7swcc8et6ze7s99khhxyl7zwy
Weblink: patreon.com/withoutworries
Allow 3-6 months on ideas. Not investment advice. DYOR
Disclaimer
The information and publications are not meant to be, and do not constitute, financial, investment, trading, or other types of advice or recommendations supplied or endorsed by TradingView. Read more in the Terms of Use.