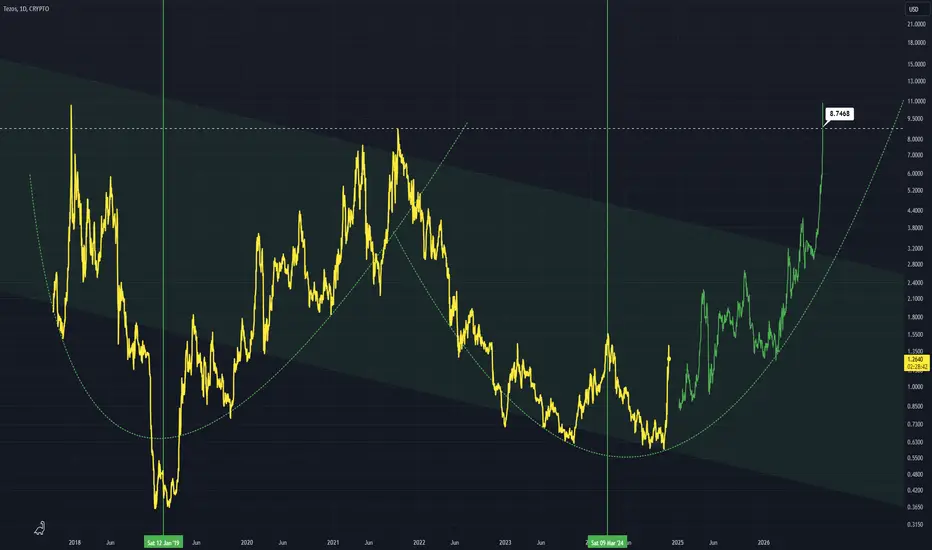
Although a large down channel can be plotted an overarching W pattern can be observed with highs at the dashed white line
Right now XTZ is moving from a bear market into a bull one
I see a pump up to about ~$8
The vertical lines show the point where the shift from bear to bull occurs
Daily chart
Right now XTZ is moving from a bear market into a bull one
I see a pump up to about ~$8
The vertical lines show the point where the shift from bear to bull occurs
Daily chart
Disclaimer
The information and publications are not meant to be, and do not constitute, financial, investment, trading, or other types of advice or recommendations supplied or endorsed by TradingView. Read more in the Terms of Use.
Disclaimer
The information and publications are not meant to be, and do not constitute, financial, investment, trading, or other types of advice or recommendations supplied or endorsed by TradingView. Read more in the Terms of Use.