Technical Analysis (1D Timeframe):
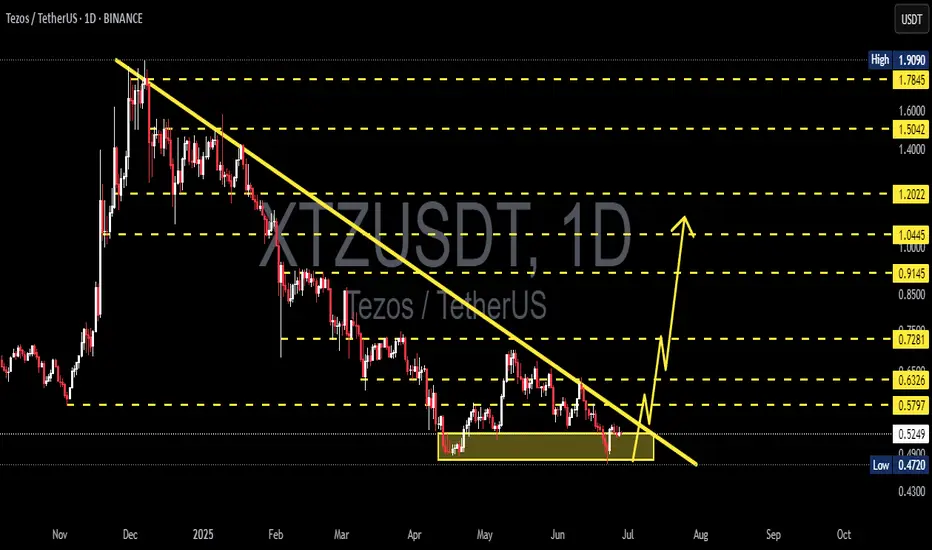
The XTZ/USDT pair is forming a well-defined descending triangle pattern, with sustained selling pressure since late 2024. However, the price action is now signaling a potential breakout as it approaches the apex of the triangle, supported by a strong accumulation zone around $0.4720–$0.5247.
🔍 Analysis Details:
Descending Trendline Resistance: Price has repeatedly failed to break above the descending resistance line since December 2024. It is now testing the edge of the triangle, which typically precedes a significant breakout.
Strong Support Zone: The consolidation zone between $0.4720 and $0.5247 has acted as a key accumulation area, successfully holding off bearish momentum.
Potential Breakout: A breakout above the triangle resistance, especially with confirmation above $0.5797, could trigger a strong bullish rally toward the next resistance levels.
🎯 Target Resistances (Upon Confirmed Breakout):
1. $0.5797 – Initial breakout confirmation
2. $0.6326 – Minor resistance
3. $0.7281 – Significant resistance from previous structure
4. $0.9145 – Medium-term bullish target
5. $1.0445 – Strong resistance zone
6. $1.2022 – Final breakout target
⚠️ Note:
A valid breakout requires a daily candle close above the descending trendline, ideally supported by volume confirmation. A pullback to the breakout zone may occur and could offer a second entry opportunity.
#XTZ #Tezos #XTZUSDT #CryptoBreakout #DescendingTriangle #AltcoinAnalysis #TechnicalAnalysis #CryptoSignals #TrendReversal #BullishSetup
✅ Get Free Signals! Join Our Telegram Channel Here: t.me/TheCryptoNuclear
✅ Twitter: twitter.com/crypto_nuclear
✅ Join Bybit : partner.bybit.com/b/nuclearvip
✅ Benefits : Lifetime Trading Fee Discount -50%
✅ Twitter: twitter.com/crypto_nuclear
✅ Join Bybit : partner.bybit.com/b/nuclearvip
✅ Benefits : Lifetime Trading Fee Discount -50%
Disclaimer
The information and publications are not meant to be, and do not constitute, financial, investment, trading, or other types of advice or recommendations supplied or endorsed by TradingView. Read more in the Terms of Use.