i analyse this for this last move up but realy i analyse this chart for more like LRC chart when finish type and show targets i show you that chart
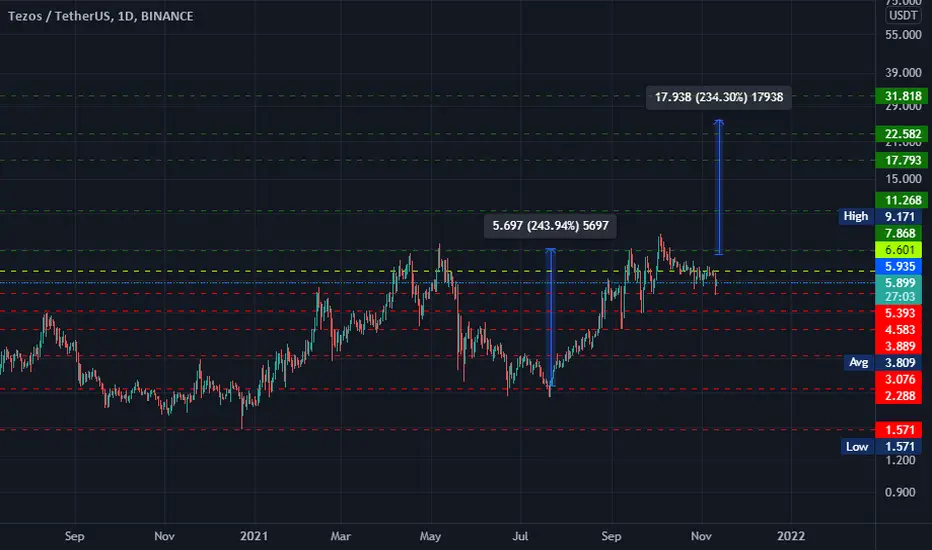
EntryPoint:
5.935
Supports:
5.393
4.583
3.889
3.076
Resistance:
6.601
Targets
7.868
11.268
17.793
22.582
31.818
GL
now watch LRC chart :
(Rememebr chart like this but fundamental difrrent and LRC going up for AXS going up)
https://tradingview.sweetlogin.com/x/63H4Iy8s/
EntryPoint:
5.935
Supports:
5.393
4.583
3.889
3.076
Resistance:
6.601
Targets
7.868
11.268
17.793
22.582
31.818
GL
now watch LRC chart :
(Rememebr chart like this but fundamental difrrent and LRC going up for AXS going up)
https://tradingview.sweetlogin.com/x/63H4Iy8s/
Related publications
Disclaimer
The information and publications are not meant to be, and do not constitute, financial, investment, trading, or other types of advice or recommendations supplied or endorsed by TradingView. Read more in the Terms of Use.
Related publications
Disclaimer
The information and publications are not meant to be, and do not constitute, financial, investment, trading, or other types of advice or recommendations supplied or endorsed by TradingView. Read more in the Terms of Use.