Long
VCash VS Bitcoin Strength
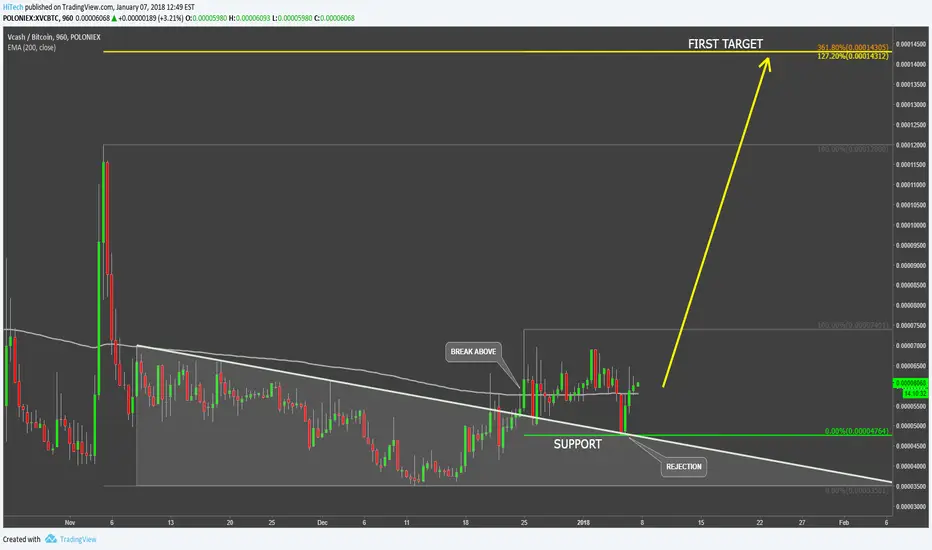
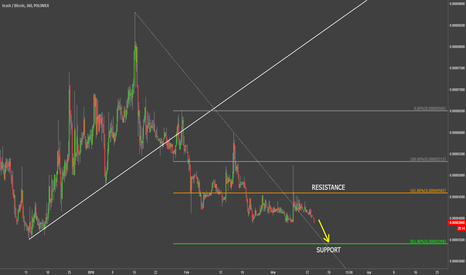
VCash managed to break above the 200 Moving Average after finding the support at 3500 satoshi. At the same time price broke above the downtrend trendline, suggesting the beginning of the uptrend.
On a corrective wave down after the resistance breakout, price returned to test 4700 satoshi support, where the downtrend trendline was rejected, this time acting as a support. The trend seems to be changing from sideways to bullish and price could jump towards 14k satoshi resistance. At this price two Fibonacci are inline, the 172.2%, and 361.8% applied to the last corrective wave down. Break above the upside target should result in further growth. At this time only a break and close below the 35k satoshi support could invalidate bullish outlook.
On a corrective wave down after the resistance breakout, price returned to test 4700 satoshi support, where the downtrend trendline was rejected, this time acting as a support. The trend seems to be changing from sideways to bullish and price could jump towards 14k satoshi resistance. At this price two Fibonacci are inline, the 172.2%, and 361.8% applied to the last corrective wave down. Break above the upside target should result in further growth. At this time only a break and close below the 35k satoshi support could invalidate bullish outlook.
Note
VCash slowly moving upwards, could go exponential soonTrade closed manually
Closed at 8k with profitTrade active
Opened at 6kNote
First major resistance 0.00012Order cancelled
Note
Disclaimer
The information and publications are not meant to be, and do not constitute, financial, investment, trading, or other types of advice or recommendations supplied or endorsed by TradingView. Read more in the Terms of Use.
Disclaimer
The information and publications are not meant to be, and do not constitute, financial, investment, trading, or other types of advice or recommendations supplied or endorsed by TradingView. Read more in the Terms of Use.