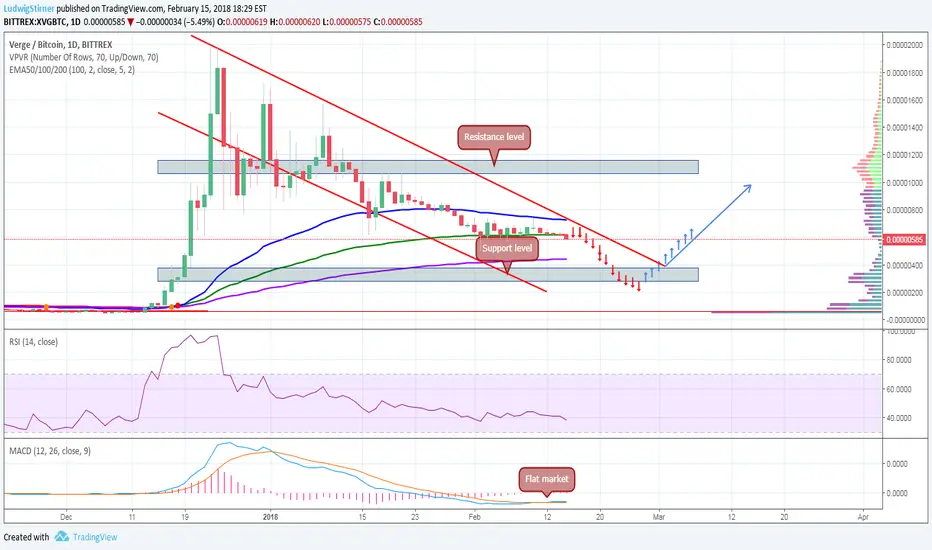
Let's start with the long term view of the XVG. The Relative Strength Index is a good indicator of the cyclical bull and bear markets. In addition, the Exponential Moving Average acts as support in a bull market and resistance in a bear market.
In January, we fell into a bear market as the RSI dropped below 50. The coin fell through the rising trend line and MACD crossed below zero. This is consistent with the fundamentals of a weakening trend, and a recession.
In the turmoil of January, VERGE fell below the support 50-Day EMA, which were indicators of further weakness. Now the coin testing the 100-Day EMA.
The MACD is trending down, though it is at a low point where it normally turns up.
We could also see a pull back from the support level at 300 Sats before making a push up through next resistance level at 600 Sats. If this happens, use the dip in price as a buying opportunity.
Disclaimer
The information and publications are not meant to be, and do not constitute, financial, investment, trading, or other types of advice or recommendations supplied or endorsed by TradingView. Read more in the Terms of Use.
Disclaimer
The information and publications are not meant to be, and do not constitute, financial, investment, trading, or other types of advice or recommendations supplied or endorsed by TradingView. Read more in the Terms of Use.