Long
XVGUSD - Update on Correction and Potential Buy Opportunities
Following our previous analysis on this CC (tradingview.com/chart/XVGUSD/PlZGVwxC-VERGE-Update-on-Potential-Buy-Opportunities/), we have seen a minor impulse to the upside - congratulations to all those who are in the buy from our entry area.
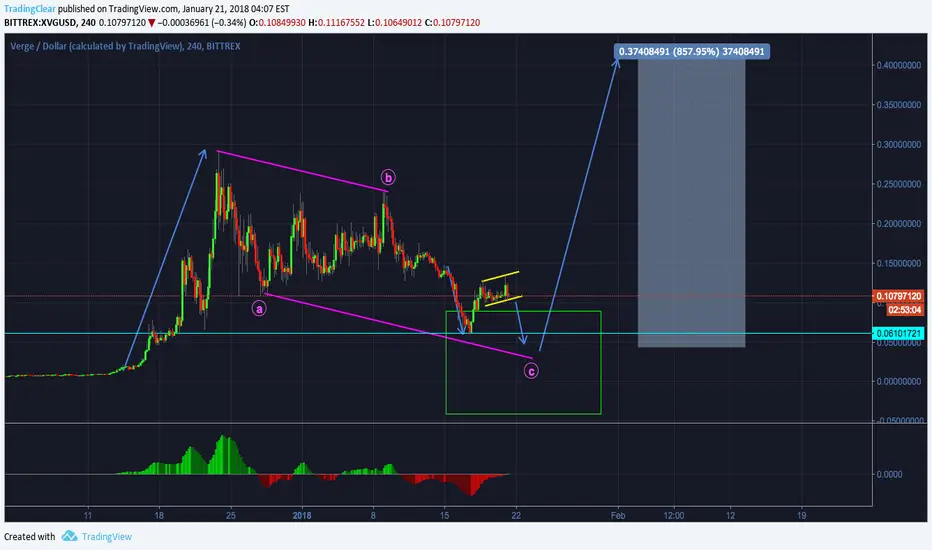
However, at this moment, this impulse to the upside seems not to be followed by it's own correction to the downside, but by a correction in the opposite sense (flag, in yellow): this would signify that, in reality, XVG $BITTREX:XVGUSD is preparing for more downside.
In this case, the downside is expected to go back and break the previous low at 0.061, before resuming it's upward impulse.
Having done all the above considerations, we recommend putting positions in break even or at least to expect a little more downside, according to where your buy entry levels are. Monitor closely.
Updates on this and smaller timeframes will follow.
In relation to cryptocurrencies, let us remind all traders that any attempt of forecasting based on wave and structural analysis has to be taken in a very conservative manner, as these financial instruments could not have been traded in the markets for a long enough time to consolidate their structure and make a valid projection possible.
If you feel that our analyses and views may be a useful complement to your trading strategies and in order to be notified in real time with our updates on the lower timeframes, please remember to click on the Follow button.
Remember that you can double check the bigger structures that are at play are on the weekly and daily time frames also by scrolling around the charts in the lower 4hr and 60min timeframes (right and left, up and down).
Trade with care and only with a backtested strategy that has proven to work in relation to your invested capital, risk appetite and potential small losses you might incur in before profiting from a good trade.
Thank you for viewing.
Disclaimer
The information and publications are not meant to be, and do not constitute, financial, investment, trading, or other types of advice or recommendations supplied or endorsed by TradingView. Read more in the Terms of Use.
Disclaimer
The information and publications are not meant to be, and do not constitute, financial, investment, trading, or other types of advice or recommendations supplied or endorsed by TradingView. Read more in the Terms of Use.