Verge is Bottoming Out! What's Up Twitter!? (XVG)
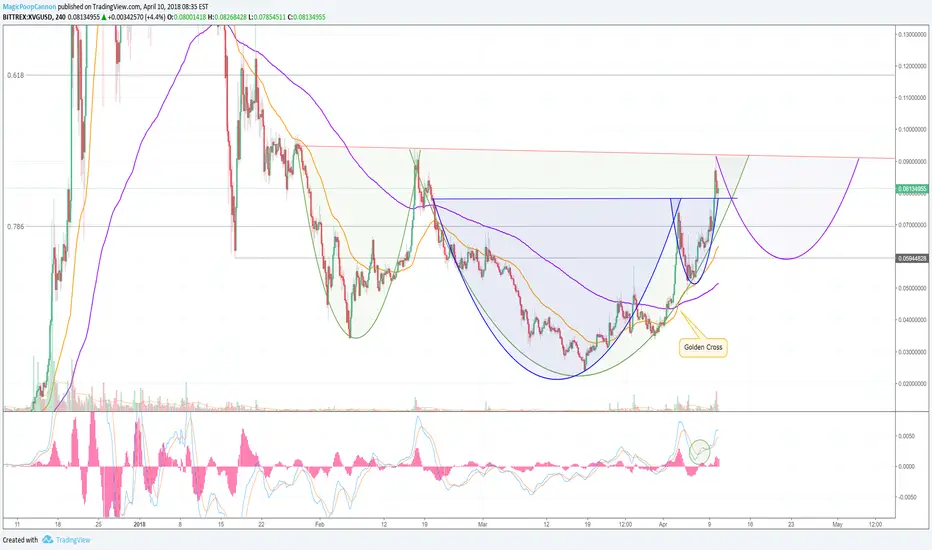
Hi friends! Congratulations to my Twitter followers, who won this weeks #coinvote, by voting for Verge! So, without further ado, let's get right to it! Looking at the four hour XVG chart, the first thing that stands out is that Verge appears to be forming a long bottoming pattern. After the all time high was made, XVG fell rapidly, and it has been consolidating ever since mid to late January.
During this consolidation, XVG has printed some bullish formations on the chart. As you can see, there is a cup and handle pattern (in blue) that Verge has created, and it has already broken out to the upside. Looking at the current action, you can see that XVG rallied out of the cup and handle, but then printed a reversal candle before falling back to the breakout level of the cup and handle. At the moment, we appear to be confirming the cup and handle breakout level as support. You can see that the current candle and the previous candle have both printed wicks that stop at the breakout level. So, this appears to be confirmation of the breakout.
However, there could be a larger inverse head and shoulders formation developing. I have highlighted the left shoulder and the head in green, but there is currently no right shoulder, so technically, it is not an inverse head and shoulders pattern, yet. What I'm trying to illustrate, is yes, there is a cup and handle here, and it did break out, but perhaps the breakout will be short lived. If that happens, and XVG drops below the breakout level of the cup and handle, then we could be looking at the development of a larger inverse head and shoulders formation here. Regardless, both scenarios are bullish, so if you're a long term holder, the technical picture of this chart looks constructive. Furthermore, you can see that there has been a golden cross, where the 50 EMA has crossed above the 200 EMA. This symbolizes a positive shift in price movement, and when coupled with other bullish indicators (such as the formations on this chart) it can have significant implications.
The important thing to note here, is that larger patterns usually trump smaller patterns inside of them. Therefore, if we don't see much of a continuation rally from the cup and handle breakout, it would be increasingly likely that we would see the formation of the right shoulder of the hypothetical inverse. A breakout above the red resistance line will put the 61.8% retrace in our sights, at about 0.117.
I'm the master of the charts, the professor, the legend, the king, and I go by the name of Magic! Au revoir.
***This information is not a recommendation to buy or sell. It is to be used for educational purposes only.***
-Magic loves you-
-JD-
Disclaimer
The information and publications are not meant to be, and do not constitute, financial, investment, trading, or other types of advice or recommendations supplied or endorsed by TradingView. Read more in the Terms of Use.
Disclaimer
The information and publications are not meant to be, and do not constitute, financial, investment, trading, or other types of advice or recommendations supplied or endorsed by TradingView. Read more in the Terms of Use.