XVGUSD - 4H log chart looks like a bullish asc triangle
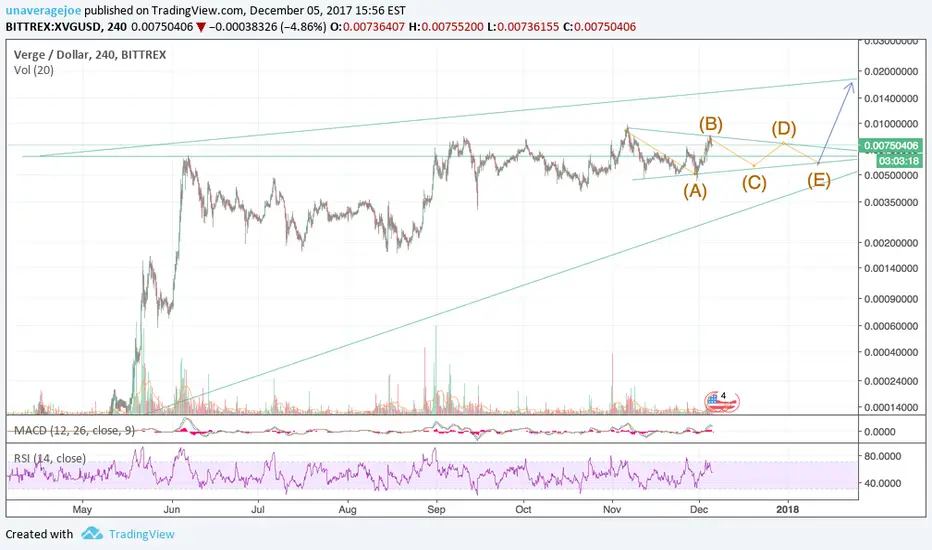
Lines are self-evident. Both the log and non-log 4H chart looks like a bullish ascending right triangle. The shape really becomes discernible on the log chart. Combined with what looks like a recent ABCDE Elliot Wave correction triangle pattern forming, expecting a bullish rally into the next month or two.
Disclaimer
The information and publications are not meant to be, and do not constitute, financial, investment, trading, or other types of advice or recommendations supplied or endorsed by TradingView. Read more in the Terms of Use.
Disclaimer
The information and publications are not meant to be, and do not constitute, financial, investment, trading, or other types of advice or recommendations supplied or endorsed by TradingView. Read more in the Terms of Use.