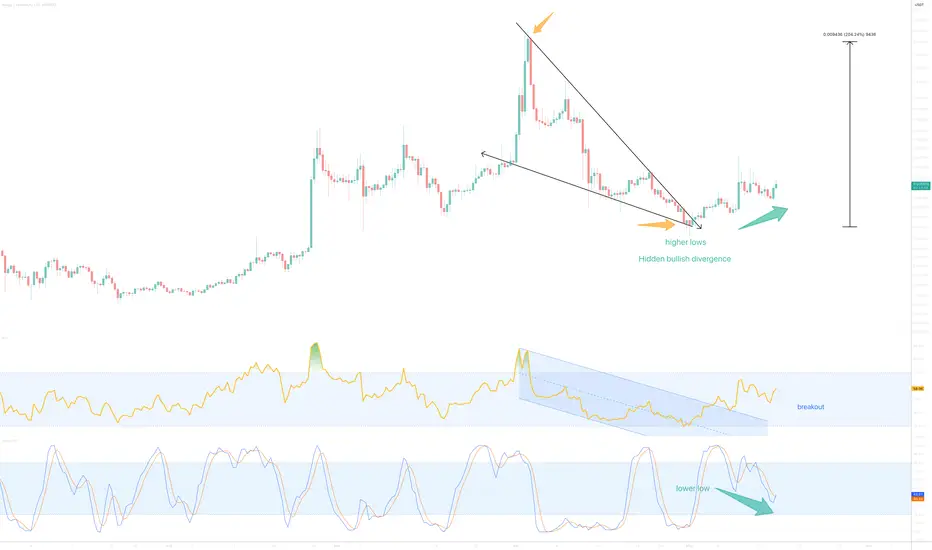
On the above 12hr chart price action has corrected 70% since early April. A number of reasons now exist to be long. They include:
1) Price action and RSI resistance breakouts.
2) Trend reversal. The first higher lows prints since March 20th. You saw what happened when the first higher low print was correctly identified 48hrs ago on Bitcoin price action at 61k
3) Hidden bullish divergence, do you see it? Price action prints a higher low with a lower low in Stochastic RSI.
4) The target area is almost 200% as measured from the pennant formation.
5) Price action on the 4 day chart prints a Dragonfly DOJI candlestick with confirmation candle as support on past resistance confirms.
Is it possible price action corrects further? Sure, sellers love selling after a 70% correction.
Is it probable? No.
Ww
Type: trade
Risk: <=3%
Timeframe for long: now
Return: At least 150%
4 day chart Dragonfly DOJI
Trade active
Note
Sellers utterly exhausted, demand tsunami imminentBTC
bc1q2eckdzh0q8vsd7swcc8et6ze7s99khhxyl7zwy
Weblink: patreon.com/withoutworries
Allow 3-6 months on ideas. Not investment advice. DYOR
bc1q2eckdzh0q8vsd7swcc8et6ze7s99khhxyl7zwy
Weblink: patreon.com/withoutworries
Allow 3-6 months on ideas. Not investment advice. DYOR
Disclaimer
The information and publications are not meant to be, and do not constitute, financial, investment, trading, or other types of advice or recommendations supplied or endorsed by TradingView. Read more in the Terms of Use.
BTC
bc1q2eckdzh0q8vsd7swcc8et6ze7s99khhxyl7zwy
Weblink: patreon.com/withoutworries
Allow 3-6 months on ideas. Not investment advice. DYOR
bc1q2eckdzh0q8vsd7swcc8et6ze7s99khhxyl7zwy
Weblink: patreon.com/withoutworries
Allow 3-6 months on ideas. Not investment advice. DYOR
Disclaimer
The information and publications are not meant to be, and do not constitute, financial, investment, trading, or other types of advice or recommendations supplied or endorsed by TradingView. Read more in the Terms of Use.