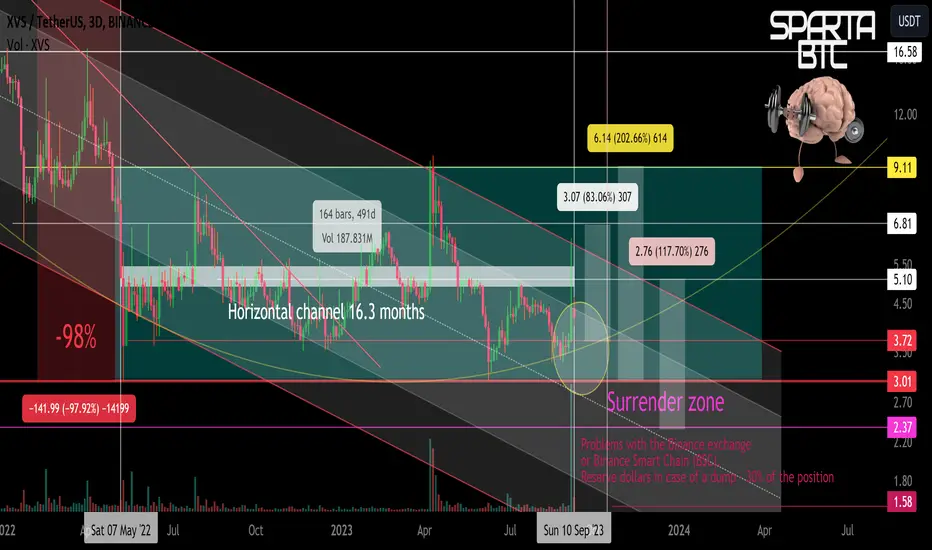
Logarithm. Time frame 3 days. Horizontal channel with a large step of 16.3 months.
Line chart of the zone for clarity.

Primary trend. Time frame 1 week.
XVS/USDT Main trend. 11 September 23
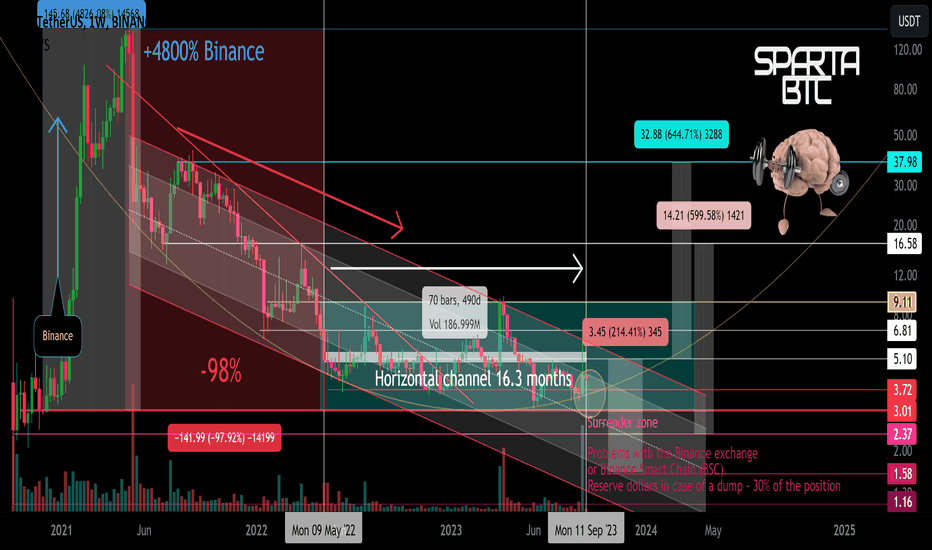
Line chart of the zone for clarity.
Primary trend. Time frame 1 week.
XVS/USDT Main trend. 11 September 23
Trade closed: target reached
Trade active
Note
✅ Telegram. Finance + Trading: t.me/SpartaBTC_1318
✅ Telegram. Сrypto trading only: t.me/SpartaBTC_tradingview
✅ Instagram: instagram.com/spartabtc_1318
✅ YouTube (Rus): goo.su/vpRzRa2
✅ Telegram. Сrypto trading only: t.me/SpartaBTC_tradingview
✅ Instagram: instagram.com/spartabtc_1318
✅ YouTube (Rus): goo.su/vpRzRa2
Related publications
Disclaimer
The information and publications are not meant to be, and do not constitute, financial, investment, trading, or other types of advice or recommendations supplied or endorsed by TradingView. Read more in the Terms of Use.