**XYO Bullish Flag Pattern on 1HR Chart**
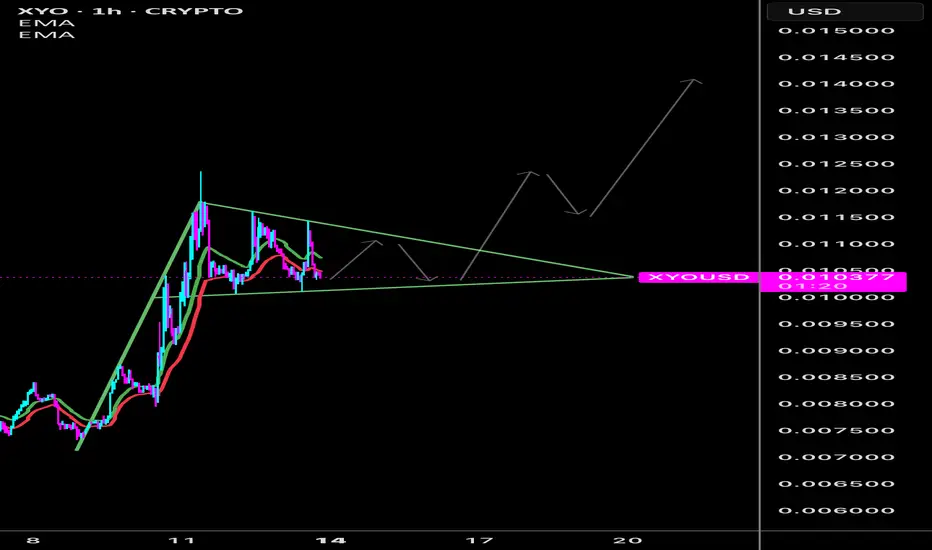
**Chart Setup**: XYO/USD on the 1-hour timeframe is carving out a bullish flag pattern, a classic continuation signal for upward momentum. Following a sharp rally (flagpole), price has entered a tight, downward-sloping consolidation channel with lower highs and lower lows. Volume is contracting during this phase, a hallmark of a flag pattern, indicating a potential explosive breakout. Resistance is at $0.0112; a decisive break above with robust volume could propel XYO above $0.015 Support holds at $0.0078, aligning with the channel’s lower trendline. RSI sits at 56, neutral and showing no overbought signals, suggesting room for upside.
**Why XYO is Bullish**: Beyond the technical setup, XYO’s outlook is promising. Its geospatial blockchain, rewarding users for sharing verified location data, taps into growing demand for decentralized IoT solutions. Use cases like supply chain tracking and smart cities align with emerging tech trends. Recent network upgrades have improved scalability, boosting confidence in its infrastructure. Community engagement is strong, with active development and growing dApp integrations. Sentiment on platforms like X shows optimism about XYO’s niche in Web3, and low token price makes it accessible for retail accumulation. If crypto market momentum continues, XYO’s unique value proposition could drive sustained interest.
XYO is also a USA based crypto. With Donald Trump building a new tax plan and possibly eliminating crypto tax on US based coins. XYO could fly high with the hype.
**Disclaimer** This is not financial advice. Crypto carries high risk. Always DYOR before investing
Disclaimer
The information and publications are not meant to be, and do not constitute, financial, investment, trading, or other types of advice or recommendations supplied or endorsed by TradingView. Read more in the Terms of Use.
Disclaimer
The information and publications are not meant to be, and do not constitute, financial, investment, trading, or other types of advice or recommendations supplied or endorsed by TradingView. Read more in the Terms of Use.