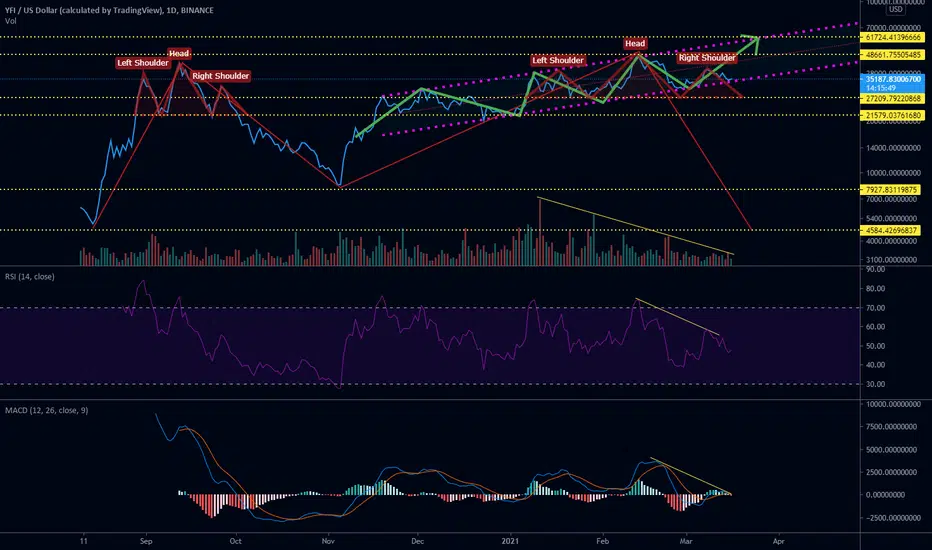
YFI has two possible directions here, either continuation within a bullish uptrend channel that takes us towards 60-61k, or completing its 2nd set of Head and Shoulders and forming a double-top, and creating a potential double bottom buying opportunity.
Volume has been going down while price has increased, and RSI & MACD are showing a bearish divergence, yet RSI is reaching low enough already to consider another move up while MACD is also capable of going in either direction.
Other the other hand, the BTC pairing is forming a wedge where it recently lost a support after 3 tests and a 4th break, (top horizontal yellow line) and it may head back up to re-test the bottom of that before heading down and testing the next support level (2nd line below):

Let's see what happens from here :)
Volume has been going down while price has increased, and RSI & MACD are showing a bearish divergence, yet RSI is reaching low enough already to consider another move up while MACD is also capable of going in either direction.
Other the other hand, the BTC pairing is forming a wedge where it recently lost a support after 3 tests and a 4th break, (top horizontal yellow line) and it may head back up to re-test the bottom of that before heading down and testing the next support level (2nd line below):
Let's see what happens from here :)
Disclaimer
The information and publications are not meant to be, and do not constitute, financial, investment, trading, or other types of advice or recommendations supplied or endorsed by TradingView. Read more in the Terms of Use.
Disclaimer
The information and publications are not meant to be, and do not constitute, financial, investment, trading, or other types of advice or recommendations supplied or endorsed by TradingView. Read more in the Terms of Use.