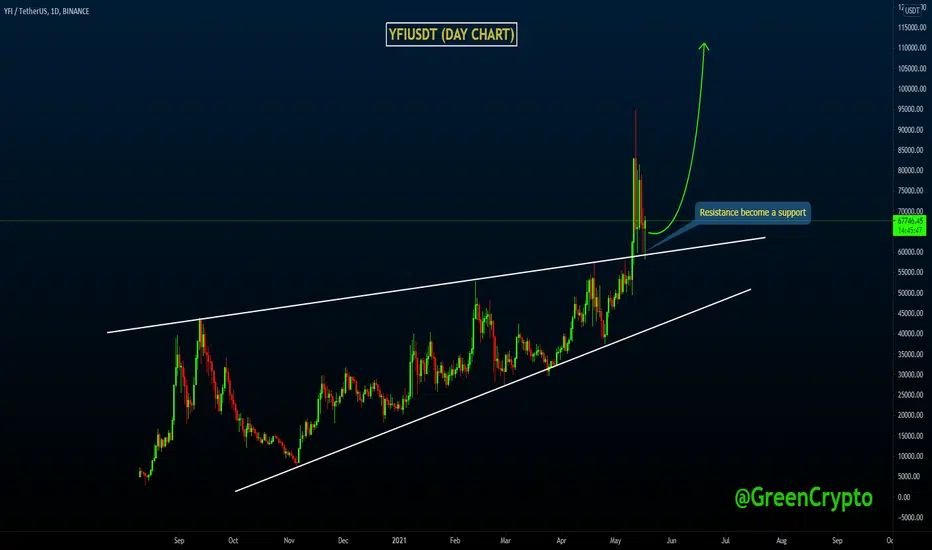
YFIUSDTUSDT(Day CHART) Technical Analysis Update
Resistance becomes support
YFI/USDT currently trading at $67,000
Buy-level: $62,000 - $67,000
Stop loss: Below $52,000
Target 1: $75,000
Target 2: $81,000
Target 3: $90,000
Target 4: $1,00,000
Max Leverage: 2X
ALWAYS KEEP STOP LOSS...
Follow Our Tradingview Account for More Technical Analysis Updates, | Like, Share and Comment Your thoughts.
📢 Telegram Channel: t.me/getgreencrypto
🆓 Free Trial / Contact Us: t.me/greencryptosupport
🌐 Website: greencrypto.net
📚 Docs: docs.greencrypto.net
🆓 Free Trial / Contact Us: t.me/greencryptosupport
🌐 Website: greencrypto.net
📚 Docs: docs.greencrypto.net
Related publications
Disclaimer
The information and publications are not meant to be, and do not constitute, financial, investment, trading, or other types of advice or recommendations supplied or endorsed by TradingView. Read more in the Terms of Use.