Long futures YFI
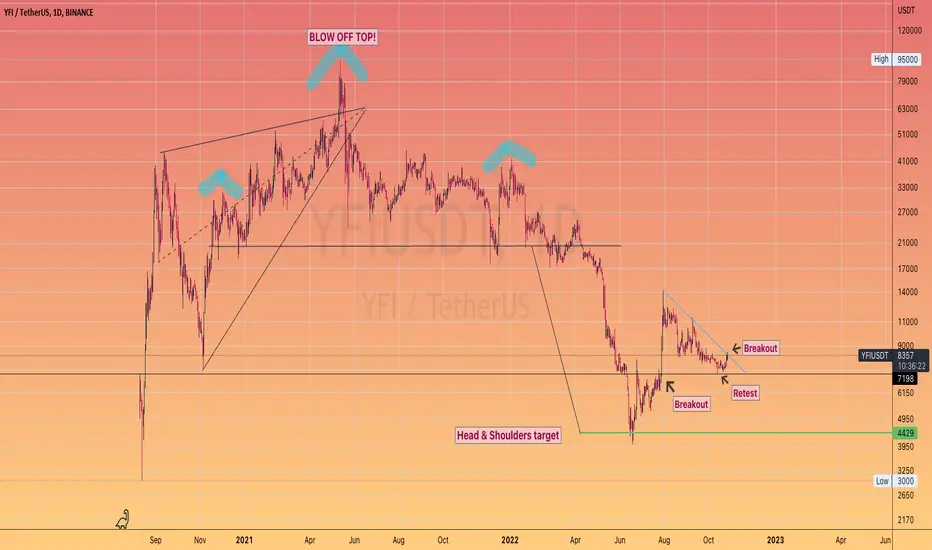
This long term chart is suggestive of higher price coming for YEARN
After the blow off top it formed a massive head and shoulders, which reached its target.
The retest of the opening candle high is a lovely textbook checkback and can spring with momentum from here
The upthrust in July suggests a similar move could see $16-$17k
(if #BTC complies of course)
Disclaimer
The information and publications are not meant to be, and do not constitute, financial, investment, trading, or other types of advice or recommendations supplied or endorsed by TradingView. Read more in the Terms of Use.
Disclaimer
The information and publications are not meant to be, and do not constitute, financial, investment, trading, or other types of advice or recommendations supplied or endorsed by TradingView. Read more in the Terms of Use.