https://tradingview.sweetlogin.com/x/BUnHr5rb/
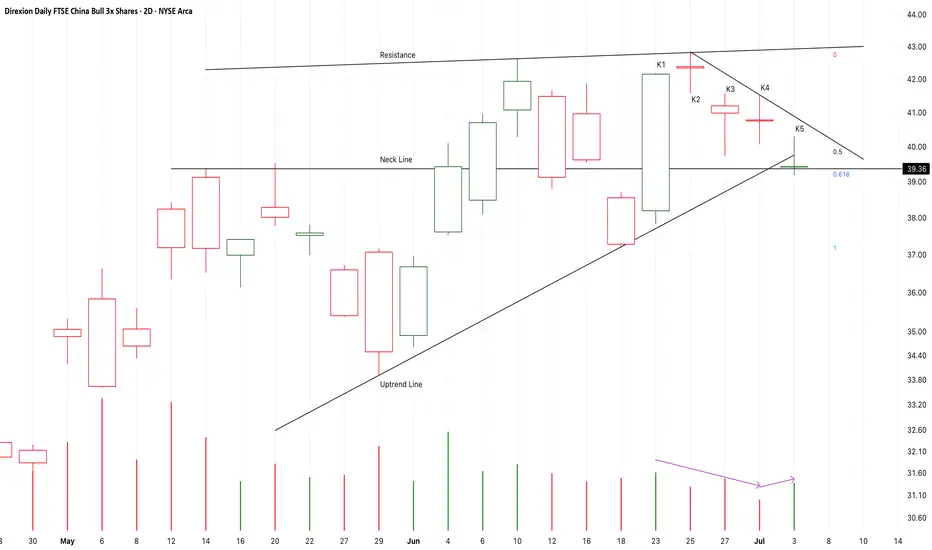
From K1 to K5,
It is a small scale consolidation or a bullish triangle pattern.
The supply pressure is decreasing too.
It seems that K6 or K7 will break up or fall down.
If the following candles close upon K3 or K4,
It is likely that another bull run will start here to test 77USD area.
On the other hand,
If the following candles close below the neck line,
The risk will sharply increase.
Long-41.6/Stop-39.9/Target-77
Trade active
From K1 to K4,
It is a potential bullish three methods pattern,
It also break up a small scale triangle pattern.
If I didn’t buy it earlier, I will try to buy it here.
The potential target at about 62-77USD at the end of this month.
Disclaimer
The information and publications are not meant to be, and do not constitute, financial, investment, trading, or other types of advice or recommendations supplied or endorsed by TradingView. Read more in the Terms of Use.
Disclaimer
The information and publications are not meant to be, and do not constitute, financial, investment, trading, or other types of advice or recommendations supplied or endorsed by TradingView. Read more in the Terms of Use.