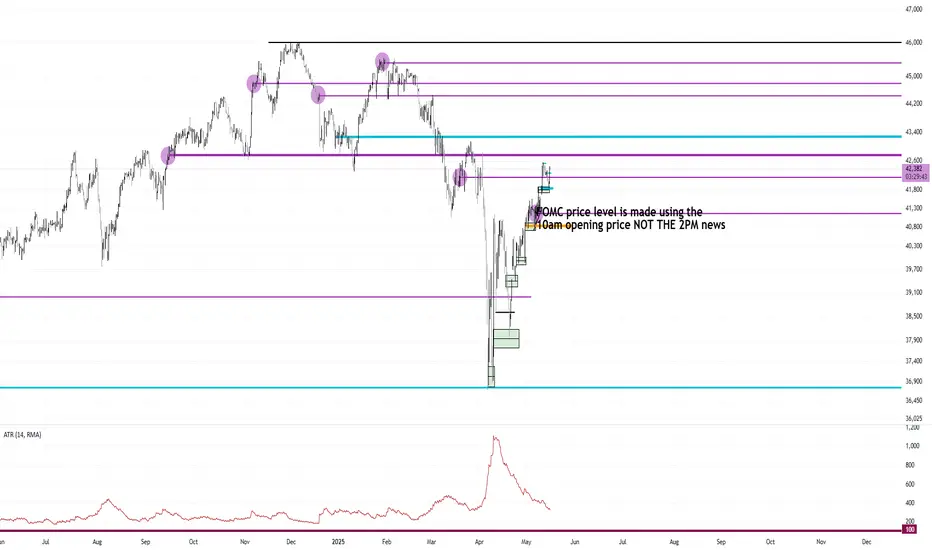
Using the 8-hour chart on the Wednesday of an FOMC release, I use a purple line on the 10am EST 8-hour candle's open as the FOMC release price point.
I then use a purple highlighter to signal the date of the release.
I have come to the conclusion that the Dow Jones Futures moves and finds support/resistance using the FOMC releases. Nothing else on the chart matters BUT each release.
There are only 2 ways these levels are used.
1. Support and Resistance levels
2. Mean Reversion levels
I have not found a single source on the ENTIRE internet that describes this phenomenon and would like to think I am quite lucky for stumbling upon this observation.
Below are examples of how/what to look for when using these levels.
Step 1:
On the 8 hour chart, mark the 10am EST opening price of that candle with a purple line and highlight

Step 2:
Project it across and see how price reacts. It will either mean revert or bounce from it
It is hilariously funny to me that price stopped dead within a measly 84 ticks away from the DEC 2023 FOMC level before bouncing.

Support and Resistance:


Mean Reversion:


Price mean reverting around the 10am opening price of FOMC Wednesday.

I then use a purple highlighter to signal the date of the release.
I have come to the conclusion that the Dow Jones Futures moves and finds support/resistance using the FOMC releases. Nothing else on the chart matters BUT each release.
There are only 2 ways these levels are used.
1. Support and Resistance levels
2. Mean Reversion levels
I have not found a single source on the ENTIRE internet that describes this phenomenon and would like to think I am quite lucky for stumbling upon this observation.
Below are examples of how/what to look for when using these levels.
Step 1:
On the 8 hour chart, mark the 10am EST opening price of that candle with a purple line and highlight
Step 2:
Project it across and see how price reacts. It will either mean revert or bounce from it
It is hilariously funny to me that price stopped dead within a measly 84 ticks away from the DEC 2023 FOMC level before bouncing.
Support and Resistance:
Mean Reversion:
Price mean reverting around the 10am opening price of FOMC Wednesday.
Note
Note
Note
Note
More Examples below of support and resistancesNote
Note
I am short off of the September 2024 FOMC level using a 150 tick stop and a 480 tick target. The market dumped 200 plus ticks off of this level right near the end of the day and hit this level by a mere 10 ticks. Wierd:?Note
Trade closed for a 2.25 to 1 on the Asia opening. All based around September's FOMC level of 42,755Disclaimer
The information and publications are not meant to be, and do not constitute, financial, investment, trading, or other types of advice or recommendations supplied or endorsed by TradingView. Read more in the Terms of Use.
Disclaimer
The information and publications are not meant to be, and do not constitute, financial, investment, trading, or other types of advice or recommendations supplied or endorsed by TradingView. Read more in the Terms of Use.