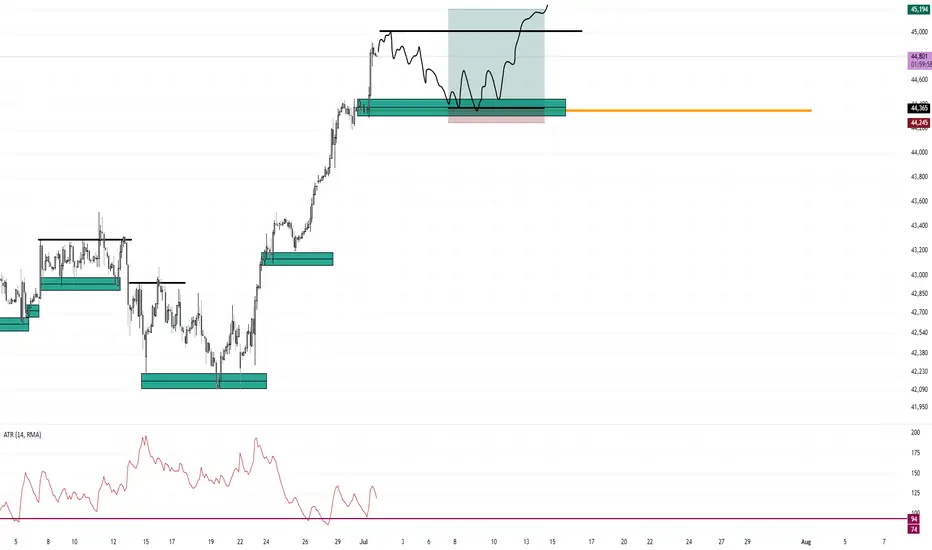
I am looking/waiting for a pullback to July's monthly open for a buy support trade in this strong bullish trend. Based on the close of the 3 month quarterly chart, the trend is EXTREMELY bullish.


This doji candle on the monthly chart for the SP500 is EXTREME Bullishness.

Below are examples of this setup. I jump ALL over this setup as soon as I see it.


This doji candle on the monthly chart for the SP500 is EXTREME Bullishness.
Below are examples of this setup. I jump ALL over this setup as soon as I see it.
Disclaimer
The information and publications are not meant to be, and do not constitute, financial, investment, trading, or other types of advice or recommendations supplied or endorsed by TradingView. Read more in the Terms of Use.
Disclaimer
The information and publications are not meant to be, and do not constitute, financial, investment, trading, or other types of advice or recommendations supplied or endorsed by TradingView. Read more in the Terms of Use.