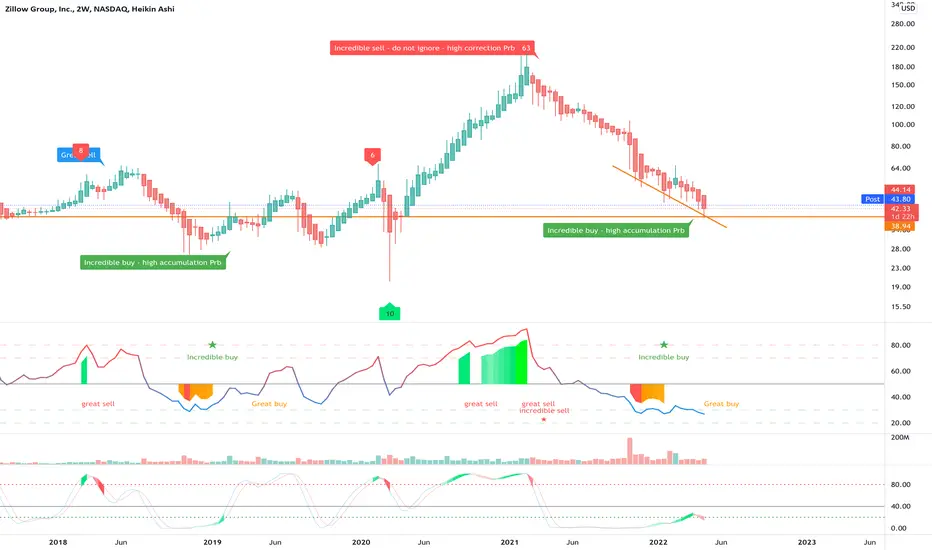
On the above 2-week chart price action has corrected over 80% since the sell signal last February. A number of reasons now exist to be bullish, a few of which are:
1) A buy signal prints.
2) Regular bullish divergence. Currently 10 oscillators are printing divergence on the weekly chart (below).
3) Support and resistance. The yearly chart (bottom - each candle = 1 year of data) is showing price action testing support on past resistance from 2017 through to 2019 @ $40. It is very likely to act as strong support.
Is it possible price action falls further? For sure.
Is it probable? Highly unlikely.
Ww
Weekly chart with bullish divergence

Annual chart - support

1) A buy signal prints.
2) Regular bullish divergence. Currently 10 oscillators are printing divergence on the weekly chart (below).
3) Support and resistance. The yearly chart (bottom - each candle = 1 year of data) is showing price action testing support on past resistance from 2017 through to 2019 @ $40. It is very likely to act as strong support.
Is it possible price action falls further? For sure.
Is it probable? Highly unlikely.
Ww
Weekly chart with bullish divergence
Annual chart - support
Trade active
On support, safe long from here. Currently up around 15%.Trade active
Price action has now confirmed trend reversal on the macro. A new bull market for this asset is confirmed.Trade active
Support on past resistance confirmed.BTC
bc1q2eckdzh0q8vsd7swcc8et6ze7s99khhxyl7zwy
Weblink: patreon.com/withoutworries
Allow 3-6 months on ideas. Not investment advice. DYOR
bc1q2eckdzh0q8vsd7swcc8et6ze7s99khhxyl7zwy
Weblink: patreon.com/withoutworries
Allow 3-6 months on ideas. Not investment advice. DYOR
Disclaimer
The information and publications are not meant to be, and do not constitute, financial, investment, trading, or other types of advice or recommendations supplied or endorsed by TradingView. Read more in the Terms of Use.
BTC
bc1q2eckdzh0q8vsd7swcc8et6ze7s99khhxyl7zwy
Weblink: patreon.com/withoutworries
Allow 3-6 months on ideas. Not investment advice. DYOR
bc1q2eckdzh0q8vsd7swcc8et6ze7s99khhxyl7zwy
Weblink: patreon.com/withoutworries
Allow 3-6 months on ideas. Not investment advice. DYOR
Disclaimer
The information and publications are not meant to be, and do not constitute, financial, investment, trading, or other types of advice or recommendations supplied or endorsed by TradingView. Read more in the Terms of Use.