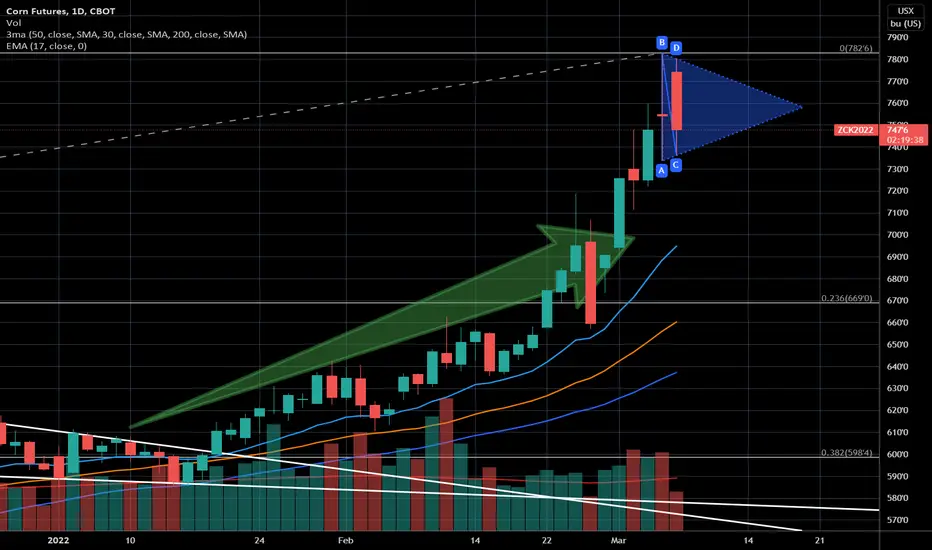
I'm still invested with the rest of my original position long in corn, but I'm ready to scale out completely. But just now, I've noticed that the highs and lows from yesterday and today COULD form a beautiful symmetric triangle. So in this uptrend, this could be a chart pattern that indicates a continuation of the existing trend in corn.
Note
The triangle was drawn a bit too narrow. Current version:Note
If the next candle opens and closes also outside the triangle, the bullish case is broken and I'm expecting rather an correction in the corn price.Note
Note
Okay, seems like we are back in business. ;)Note
Continuation of the bullish trend is now very likely.Note
Price action looks a bit weak ATM. So it could be wise to extend the triangle like this:Order cancelled
Setup no more valid- triangle broken to the wrong side.Related publications
Disclaimer
The information and publications are not meant to be, and do not constitute, financial, investment, trading, or other types of advice or recommendations supplied or endorsed by TradingView. Read more in the Terms of Use.
Related publications
Disclaimer
The information and publications are not meant to be, and do not constitute, financial, investment, trading, or other types of advice or recommendations supplied or endorsed by TradingView. Read more in the Terms of Use.