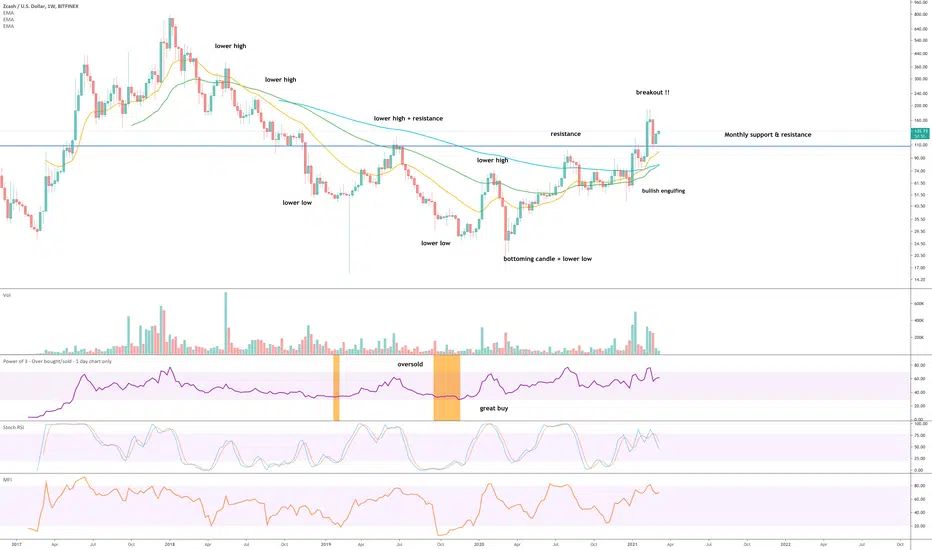
On the above weekly chart price action made a 90% correction with oversold condition (orange column) followed by a consolidation period. That consolidation period has now ended resulting in an excellent buying opportunity.
Why bullish?
1) The trend. Lower highs lower lows are no longer since the bottoming candle. A trend reversal was confirmed at the breakout of market structure.
2) Price action is above the 100-week EMA following the 21-week crossing the 50-week. very bullish.
3) Lastly the ZEC/Bitcoin chart. More than 2-years of price action resistance was recently broken following an oversold condition. Fantastic.
1st target $1500
A buy from $103 is excellent if you can get it, unlikely to fall below that in the near term.
Weekly ZEC/BTC chart:
Note
Timeframe to target? Before the summer. Yes 2021 ;-)Trade active
Trade active
Two very exciting moves in price action:1) Price action breaks out of resistance on the weekly chart (circled in orange).
2) The 10-day chart just printed a Dragonfly DOJI candle (circled in orange). This is very bullish for the weeks ahead.
Near term target is: $316
Trade active
And we're off!Trade active
Super impressive Dragonfly DOJI just printed on the 4-day chart.Trade active
Arrived at near term target $316. Might float around here until support is established. Next near term target $758 - taking us to the previous ATH. Thereafter $1500... and beyond, but will wait until we're there before projecting and confidence is high.
Note
Looking good. Price action is finding support off a significant resistance - look left, circled in orange.Trade active
That was a brutal. However it was also much needed to remove weak hands from the market.Price action retraced to a support level last seen in July 2017. You can also see from wicks on the daily chart below a lot of buyers came in at a support. Look left.
Note
In all the years I’ve been at this investing malarkey I’ve never seen a sell off like this. It is no exaggeration, the market has not seen a sell off like this at any point in its history. The sell off in the past week alone is not even matched by the sell off of March 2020.
Is the trade still open? Yes.
Price action is on support / past resistance with the trend making higher highs / higher lows.
Note
"incredible buy" condition now appears on the daily chart.Trade active
I did not think for a moment price would be back down here again, but here we are, at the bottom of the upward trend line. Furthermore price action is on past resistance, it is very probable that support is found here. This is a opportunity.Trade active
Dragonfly DOJI printed on the 10-day chart, price action should return to the recent high of $270 fairly quickly, after which the progress to the top target can continue.Trade active
On the 3-day chart below price action has corrected back to past resistance. There is good evidence to suggest this level is now support.1) The bullish engulfing candle recently printed on resistance following the sell off.
2)RSI resistance breakout following the ‘good buy’ signal (yellow column).
3) Stochastic RSI crosses up 20. A reminder, this is a 3-day chart. Look left. Circled in green is each cross up. Compared with the impact on price action.
The $1500 target remains valid, fret not.
Note
On the 2-week chart below (new candle prints on Monday) price action continues to print higher highs / higher lows = be long.Price action appears to be testing support on past resistance very soon around $88. Price action falling to $50 would be a break of market structure.
The only concern for further down side is the RSI. It has drifted below 50. That’s not great, it is unlikely significant moves to the upside shall be made under 50. However keep in mind this is a 2-week chart about to test past resistance, it is very probable strong support will be seen here.
Something else worth considering as ALL crypto has recently taken a hit, what is the alt-coin market total doing?
On the 2-week chart we can see the 21-week EMA is currently being test. Look left. We’re in a bull market - I’ve circled previous tests.
If the 21-EMA holds it will be the most bullish indicator we’ve had for months.
Trade active
Price action resistance has broken out with higher low confirmed. The next move will be back up to test resistance at $306Trade active
Stochastic RSI closes the weekly with a cross up of 20 (circled in purple), look left.This is a good indication of the weeks to come. Hopefully the $300 resistance shall be broken on this run.
Note
Might be a good moment, 8hr prints an impressive Dragonfly DOJI as price action lands on the golden ratio.Trade active
Good - this is what you want to see on the alt / BTC chart, not all alts are showing this signal.Note
30 days later the 'incredible buy' signal delivers yet again.At this moment on the weekly chart (below) the close of last week printed a huge buying pressure candle. $308 should be interesting, the 5th attempt at resistance. There's a lot of momentum right now, I think it'll power straight past.
Trade active
Can't fault the structure on zcash, higher highs higher lows, the trend is your friend. If you look closer you can see the 2-day candle is printing massive support for the 2-day / 200-day SMA, excellent. Be patient.Note
Price action is actually on the 0.618 golden ratio from the last lower high.Note
Market structure appears to have broken. Need to wait until the week closes to confirm. Wait until the BTC sellers capitulate.Note
DOJi prints on 2-day chart AND on support. A move to $155 area is almost certain.Trade active
** target update $1600 **Trade active
Forgot to add chart...The reason for not updating this idea since January is simple, support was broken. However that support has recovered. That's is a strong signal.
On the 5-day chart below support is printing following a breakout. The flagpole extension now brings the target to $1600 to $2200 area.
A break above $200 makes this target highly probable.
Note
The above flagpole and extension is seen more clearly on the monthly chart below.Wait for the break above $200. If you see that, the target will come in the months ahead.
Trade active
Feels like this one is taking forever... the principles that led me to publish this idea remain intact, higher highs and higher lows. Market structure is solid.Something interesting on the weekly BTC pair. A life cross has just printed with a Dragonfly DOJI candle.
Let's Go zcash!
Note
** Target update, $5k **3-day chart
1-day chart - price action should break out by July 10-15th at latest.
BTC
bc1q2eckdzh0q8vsd7swcc8et6ze7s99khhxyl7zwy
Weblink: patreon.com/withoutworries
Allow 3-6 months on ideas. Not investment advice. DYOR
bc1q2eckdzh0q8vsd7swcc8et6ze7s99khhxyl7zwy
Weblink: patreon.com/withoutworries
Allow 3-6 months on ideas. Not investment advice. DYOR
Disclaimer
The information and publications are not meant to be, and do not constitute, financial, investment, trading, or other types of advice or recommendations supplied or endorsed by TradingView. Read more in the Terms of Use.