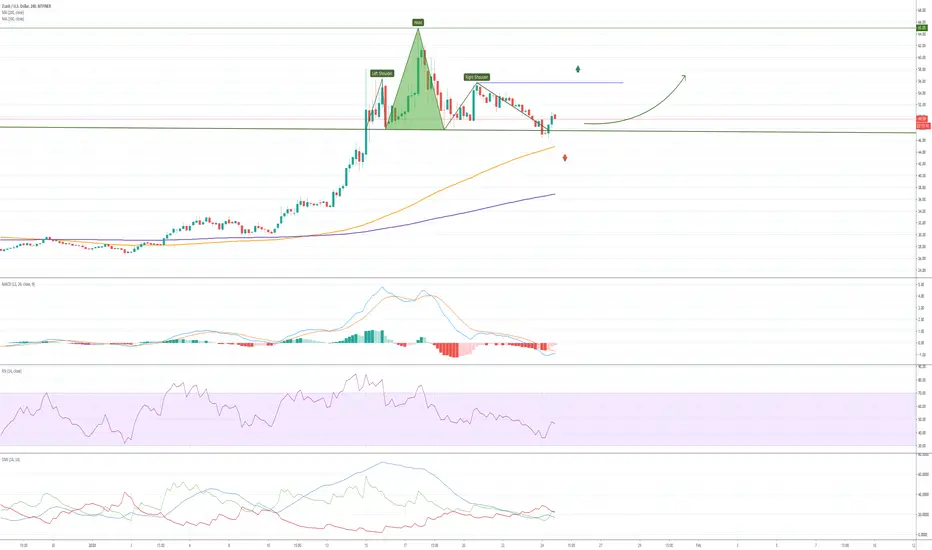
If we look at the 4H chart, we will see the Head&Shoulders chart pattern. It belongs to a reversal group of patterns.
We need to get a breakout below the neckline, just in order to confirm this pattern. The price tried to break this signal line, but now we have a reversal from this line. It means that a strong bearish signal probably won't be developed into a further downward movement.
If so, the false bearish signal becomes a new bullish signal which will be able to confirm the continuation of the uptrend. For this, the price will have to move above the right shoulder.
If we talk about a possible buy opportunity, the price reversal from the signal line of the chart pattern can be used to open long trades. Stop orders for such trades must be placed below the local swing low. The profit targets should be at the right shoulder and 65.00 resistance.
If the price drops below SMA100, the trend reversal chart pattern will be workable again, and we should be ready to see the downward movement to SMA200.
Disclaimer!
This post does not provide financial advice. It is for educational purposes only! You can use the information from the post to make your own trading plan for the market. But you must do your own research and use it as the priority. Trading is risky, and it is not suitable for everyone. Only you can be responsible for your trading.
💰COPY MY TRADES FOR FREE! Join 👉 bit.ly/41DKDBD
📣 Get Welcome Bonuses for 1st Trade 👉 bit.ly/bonus_bybit
💎 Share My BEST Trades here 👉 bit.ly/wubits
📣 Get Welcome Bonuses for 1st Trade 👉 bit.ly/bonus_bybit
💎 Share My BEST Trades here 👉 bit.ly/wubits
Disclaimer
The information and publications are not meant to be, and do not constitute, financial, investment, trading, or other types of advice or recommendations supplied or endorsed by TradingView. Read more in the Terms of Use.