Education
How To Trade The Symmetrical Triangle (Higher Lows, Lower Highs)
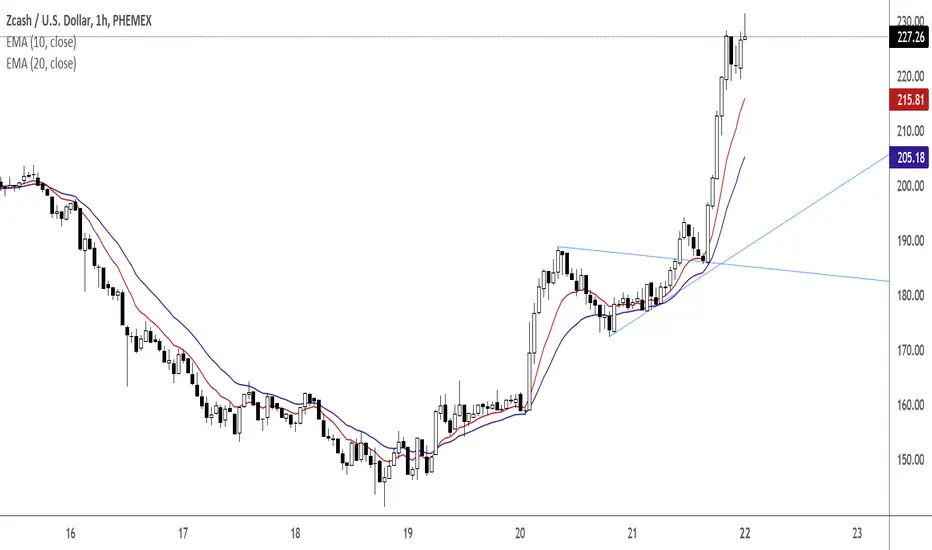
Lower Highs are represented by the diagonal trend line. These lower highs are the resistance line.

Higher Lows are represented by the diagonal trend line. These higher lows are the support line.

Breakout Candlestick

Retest Candlestick

How To Trade The Triangle Chart Pattern
First, Look For An Up Trend

Second, Draw Diagonal Support Line and then draw Diagonal Resistance Line. These lines are your levels.

Third, Wait For The Breakout Candle. Enter after the candle closes.
Fourth, Wait For A Candlestick To Retest Diagonal Trend Line. Enter after the retest candlestick closes.
Fifth, Set Target Using Height of Pattern

Higher Lows are represented by the diagonal trend line. These higher lows are the support line.
Breakout Candlestick
Retest Candlestick
How To Trade The Triangle Chart Pattern
First, Look For An Up Trend
Second, Draw Diagonal Support Line and then draw Diagonal Resistance Line. These lines are your levels.
Third, Wait For The Breakout Candle. Enter after the candle closes.
Fourth, Wait For A Candlestick To Retest Diagonal Trend Line. Enter after the retest candlestick closes.
Fifth, Set Target Using Height of Pattern
Disclaimer
The information and publications are not meant to be, and do not constitute, financial, investment, trading, or other types of advice or recommendations supplied or endorsed by TradingView. Read more in the Terms of Use.
Disclaimer
The information and publications are not meant to be, and do not constitute, financial, investment, trading, or other types of advice or recommendations supplied or endorsed by TradingView. Read more in the Terms of Use.