Hi my friends
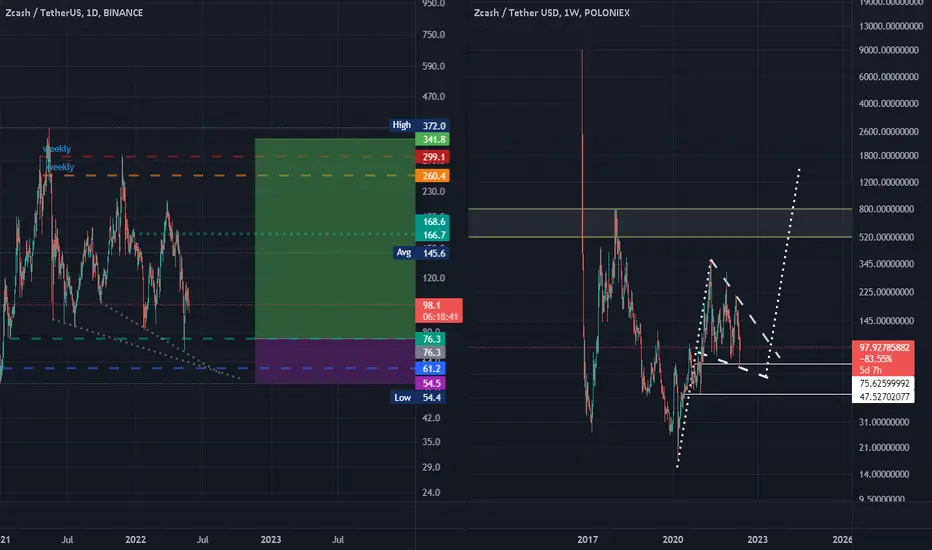
In this new chart, I want to show you zec, which is likely to form a falling flag over a weekly time frame.
Which I have specified in the chart
And if my guess is correct, it could increase dramatically
In this new chart, I want to show you zec, which is likely to form a falling flag over a weekly time frame.
Which I have specified in the chart
And if my guess is correct, it could increase dramatically
Related publications
Disclaimer
The information and publications are not meant to be, and do not constitute, financial, investment, trading, or other types of advice or recommendations supplied or endorsed by TradingView. Read more in the Terms of Use.
Related publications
Disclaimer
The information and publications are not meant to be, and do not constitute, financial, investment, trading, or other types of advice or recommendations supplied or endorsed by TradingView. Read more in the Terms of Use.