Hi there,
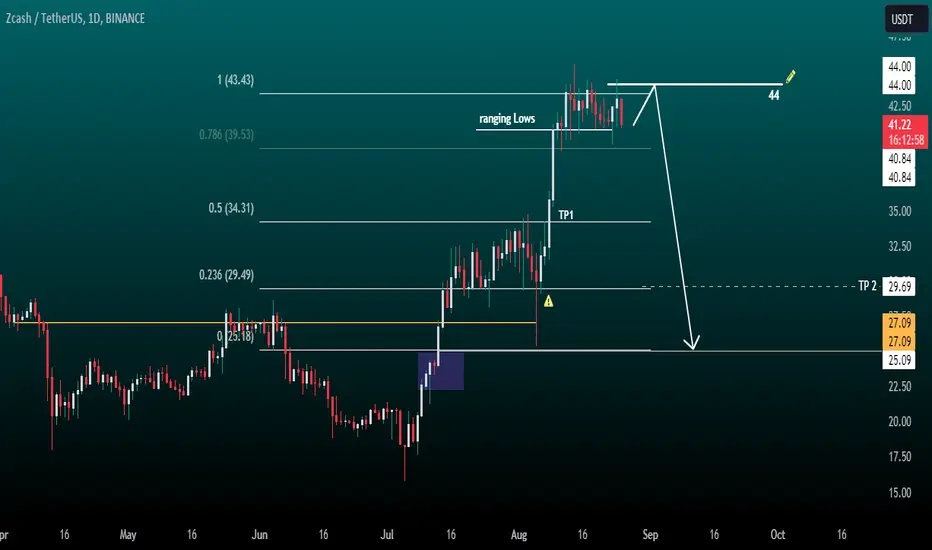
ZECUSDT looks bearish on the daily chart, with 39.53 being the nearest support level that will be tested in lower time frames. The bias is 25.09, with two price targets.
Keep in mind that the price is attracted to the 44 area, as the market is currently ranging between lows and highs.
Happy Trading,
K.
Trade closed: target reached
Objective met, have a great week.Disclaimer
The information and publications are not meant to be, and do not constitute, financial, investment, trading, or other types of advice or recommendations supplied or endorsed by TradingView. Read more in the Terms of Use.
Disclaimer
The information and publications are not meant to be, and do not constitute, financial, investment, trading, or other types of advice or recommendations supplied or endorsed by TradingView. Read more in the Terms of Use.