Continuing along the theme that the best opportunities are found in alt-tokens…
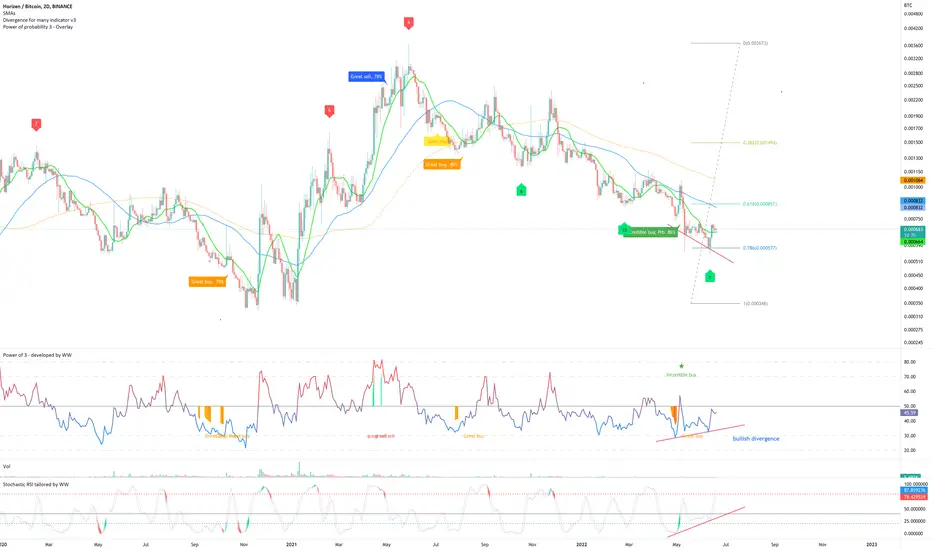
On the above 2-day chart price action has corrected 80% since May 2021. A number of reasons now exist to be bullish , including:
1) The ‘incredible buy’ signal.
2) Regular bullish divergence . Multiple oscillators are currently printing positive divergence.
3) Price action tests an area of strong support and resistance . (10-day chart below)
4) That same support / resistance is also the Fibonacci 0.786 level, fantastic.
5) This token is on the ‘what if’ list.
Is it possible price action falls further? For sure.
Is it probable? Very unlikely.
Good luck!
Ww
PS: I’m not trading this so please ask below for updates.
Type: trade
Risk: <=6% of portfolio
Timeframe: 3 to 9 months
Return: don’t know
10-day chart
BTC
bc1q2eckdzh0q8vsd7swcc8et6ze7s99khhxyl7zwy
Weblink: patreon.com/withoutworries
Allow 3-6 months on ideas. Not investment advice. DYOR
bc1q2eckdzh0q8vsd7swcc8et6ze7s99khhxyl7zwy
Weblink: patreon.com/withoutworries
Allow 3-6 months on ideas. Not investment advice. DYOR
Related publications
Disclaimer
The information and publications are not meant to be, and do not constitute, financial, investment, trading, or other types of advice or recommendations supplied or endorsed by TradingView. Read more in the Terms of Use.