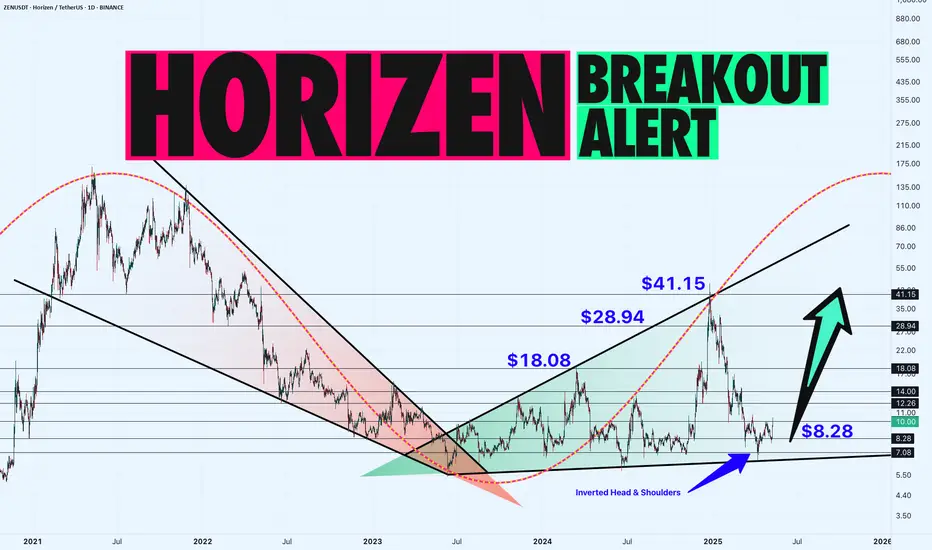
Hey traders! Let’s dive into this daily ZENUSDT chart. Horizon is in a sideways accumulation phase, forming an Expanding Wedge right after a massive bullish Falling Wedge breakout.
We’re also seeing a small inverted head and shoulders at the bottom support range of $7.08-$10.08, with the neckline at $10.08. ZEN recently revisited this level, and a confirmed breakout could propel it toward $18.08-$28.94, with a major target at $41.15.
If the breakout fails, we might see a pullback to the neckline at $10.08 or the shoulder support at $8.28.

Key Levels to Watch:
Is ZEN about to skyrocket, or will this breakout fail? Let’s hear your thoughts below!
We’re also seeing a small inverted head and shoulders at the bottom support range of $7.08-$10.08, with the neckline at $10.08. ZEN recently revisited this level, and a confirmed breakout could propel it toward $18.08-$28.94, with a major target at $41.15.
If the breakout fails, we might see a pullback to the neckline at $10.08 or the shoulder support at $8.28.
Key Levels to Watch:
Resistance: $18.08, $28.94, $41.15
Support: $8.28
Breakout Target: $41.15
Breakdown Risk: $8.28
Is ZEN about to skyrocket, or will this breakout fail? Let’s hear your thoughts below!
𝗔𝗥𝗧𝗘𝗠 𝗖𝗥𝗬𝗣𝗧𝗢 | 𝗦𝗶𝗻𝗰𝗲 𝟮𝟬𝟭𝟴
📲 Join Our Telegram Trading Community: t.me/+5hlxWmhHaKplN2Rk
🎙️ Daily Live Streams on 🔴 𝗬𝗼𝘂𝗧𝘂𝗯𝗲
🔍 Explore More Resources: linktr.ee/artemcrypto ✅
📲 Join Our Telegram Trading Community: t.me/+5hlxWmhHaKplN2Rk
🎙️ Daily Live Streams on 🔴 𝗬𝗼𝘂𝗧𝘂𝗯𝗲
🔍 Explore More Resources: linktr.ee/artemcrypto ✅
Disclaimer
The information and publications are not meant to be, and do not constitute, financial, investment, trading, or other types of advice or recommendations supplied or endorsed by TradingView. Read more in the Terms of Use.