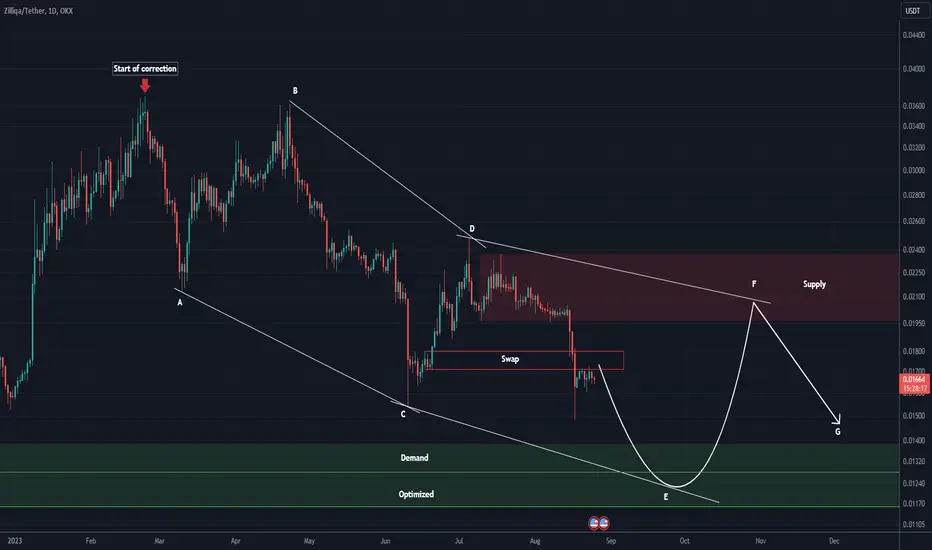
Where I entered "Start of correction" is the beginning of our diametric correction pattern.
What the chart shows us seems to be inside wave E of this diametric.
The green area could be where our diametrical F wave starts and moves up to our red area.
Do not open any position without capital management and stop setting.
What the chart shows us seems to be inside wave E of this diametric.
The green area could be where our diametrical F wave starts and moves up to our red area.
Do not open any position without capital management and stop setting.
🔆To succeed in trading, just enter our Telegram channel:
Free membership: t.me/Behdark_EN
🔷Our Telegram channel has daily spot and futures signals 👉 t.me/Behdark_EN
💎 Exclusive signals are only shared on our Telegram channel
Free membership: t.me/Behdark_EN
🔷Our Telegram channel has daily spot and futures signals 👉 t.me/Behdark_EN
💎 Exclusive signals are only shared on our Telegram channel
Disclaimer
The information and publications are not meant to be, and do not constitute, financial, investment, trading, or other types of advice or recommendations supplied or endorsed by TradingView. Read more in the Terms of Use.