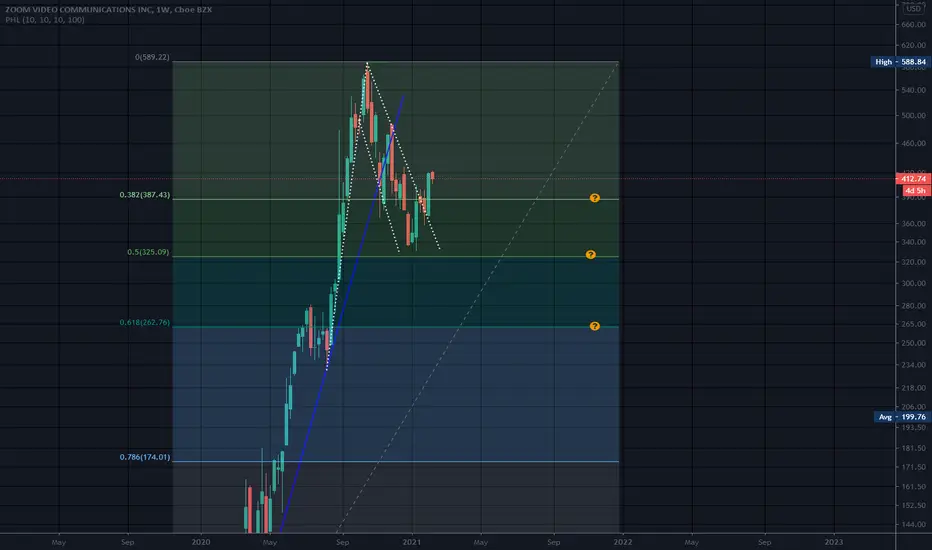
Weekly chart. Weekly charts often show you the true angle of the run up (or monthly)
If this is a parabolic arc pattern, most pull back 50% to 62% during correction mode, or somewhere in between as well. It is possible to fall back deeper. Arc patterns do not usually "Blast off" when they hit their level either as other stocks hit a sweet spot and Boom, off they go. Patience would be required perhaps as zoom had a steep rise up..
If this is an arc pattern, there can be volatility for an extended amount of time..
Just an observation and not a recommendation
Disclaimer
The information and publications are not meant to be, and do not constitute, financial, investment, trading, or other types of advice or recommendations supplied or endorsed by TradingView. Read more in the Terms of Use.
Disclaimer
The information and publications are not meant to be, and do not constitute, financial, investment, trading, or other types of advice or recommendations supplied or endorsed by TradingView. Read more in the Terms of Use.