📌 Overview:
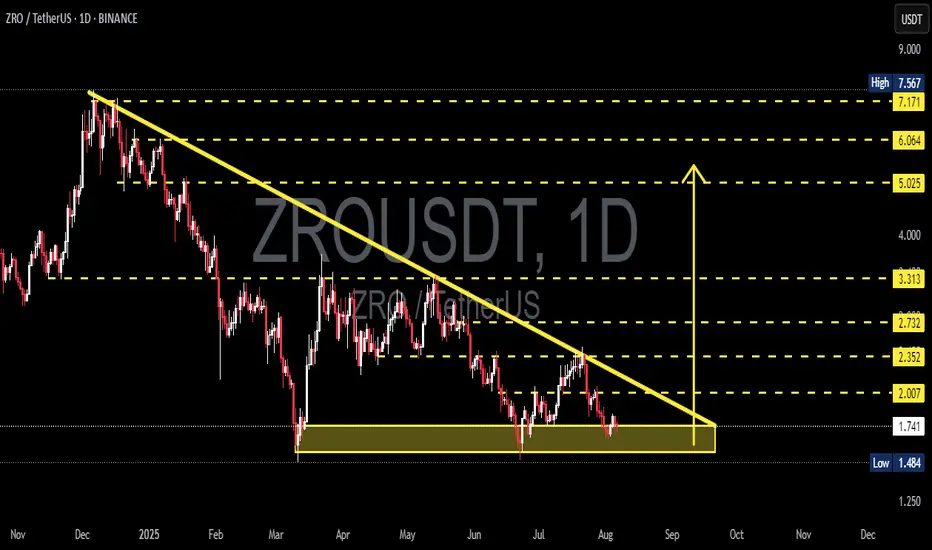
The ZRO/USDT pair is currently at a highly critical point. Price action has been consolidating within a large Descending Triangle for several months, and is now coiling near the apex — a classic signal of an incoming major move.
The strong support zone around 1.73 – 1.74 USDT has been tested multiple times and continues to hold, while the long-standing descending trendline from the all-time high acts as key dynamic resistance.
---
📊 Pattern & Market Structure Analysis:
🟡 Pattern: Descending Triangle
Flat horizontal support at ~1.73 USDT has acted as a demand zone.
Consistent lower highs suggest continued selling pressure and market indecision.
While typically a bearish continuation pattern, this setup can also lead to a bullish reversal breakout if resistance is breached with volume.
🧱 Key Support:
The highlighted yellow box shows clear accumulation, where buyers continue to defend the zone.
A breakdown below this support could trigger sharp downside movement and panic selling.
📉 Descending Resistance:
The downward sloping trendline is the critical breakout level.
A strong daily candle close above it would invalidate the bearish structure.
---
🚀 Bullish Scenario (Breakout):
If the price successfully breaks above the descending trendline with volume:
Short-term targets: 2.007 → 2.352 USDT
Mid-term targets: 2.732 → 3.313 USDT
Long-term bullish targets: 5.025 – 6.064 USDT and beyond
Additional confirmations: Volume spike, bullish RSI breakout, daily close above resistance.
---
🔻 Bearish Scenario (Breakdown):
If price fails to hold 1.73 USDT and breaks down:
Initial downside target: 1.484 USDT (historical support)
If that fails, ZRO may enter new low zones below 1.40
Breakdown with high volume would validate a strong bearish trend continuation.
---
🧠 Possible Strategies:
Breakout traders: Entry on daily candle close above descending trendline with volume.
Retest buyers: Wait for breakout, then enter on a successful retest of the trendline as new support.
Short sellers: Look for breakdown below 1.73 zone for short opportunities to 1.48 or lower.
Always use tight stop-loss based on volatility and support/resistance zones.
---
📈 Conclusion:
ZRO is at a make-or-break point. The market is coiling tightly within a Descending Triangle, and a massive move is likely just around the corner. Whether that move is up or down will depend on how price reacts to the descending trendline and the horizontal support.
Traders should stay alert and watch for either a confirmed breakout above the trendline, or a confirmed breakdown below the 1.73 USDT support level. The reaction here will set the tone for ZRO’s next big trend.
#ZRO #ZROUSDT #CryptoBreakout #TechnicalAnalysis #DescendingTriangle #AltcoinSetup #SupportAndResistance #CryptoChart #BreakoutWatch
✅ Get Free Signals! Join Our Telegram Channel Here: t.me/TheCryptoNuclear
✅ Twitter: twitter.com/crypto_nuclear
✅ Join Bybit : partner.bybit.com/b/nuclearvip
✅ Benefits : Lifetime Trading Fee Discount -50%
✅ Twitter: twitter.com/crypto_nuclear
✅ Join Bybit : partner.bybit.com/b/nuclearvip
✅ Benefits : Lifetime Trading Fee Discount -50%
Disclaimer
The information and publications are not meant to be, and do not constitute, financial, investment, trading, or other types of advice or recommendations supplied or endorsed by TradingView. Read more in the Terms of Use.